08:58
Precalculus: Graphical, Numerical, Algebraic
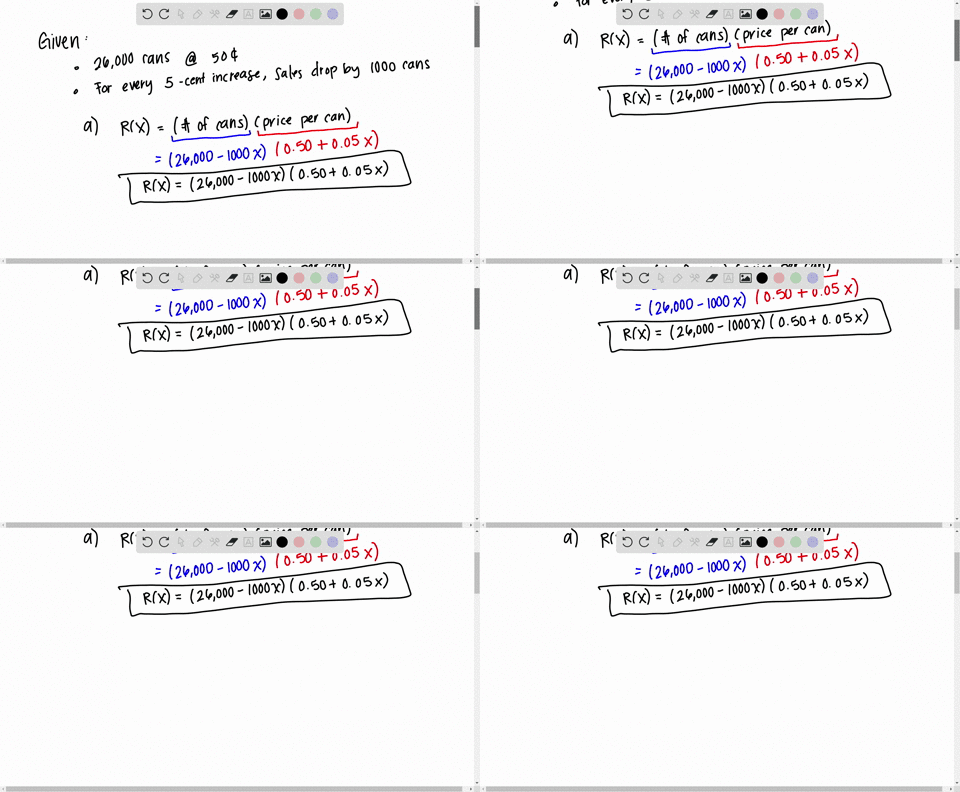
The Sweet Drip Beverage Co. sells cans of soda pop in machines. It finds that sales average $26,000$ cans per month when the cans sell for 50 e each. For each nickel increase in the price, the sales per month drop by 1000 cans.
(a) Determine a function $R(x)$ that models the total revenue realized by Sweet Drip, where $x$ is the number of $\$ 0.05$ increases in the price of a can.
(b) Find a graph of $R(x)$ that clearly shows a maximum for $R(x)$ .
(c) How much should Sweet Drip charge per can to realize the maximum revenue? What is the maximum revenue?