Wendi Obritz

University of La Verne
Math Teacher

Biography

I have been a math teacher for the last 23 years. I have taught everything from pre-algebra through pre-calculus at multiple ability levels including AP Statistics and IB Math Studies. I've taught slower paced classes for students who have a hard time with math and accelerated classes for students who excel at math. I love helping kids at all ability levels understand math!

Education

BS Mathematics
University of La Verne
MA Education
Claremont Graduate University

Educator Statistics

Numerade tutor for 6 years
67 Students Helped

Topics Covered

Maximizing Accuracy with Effective Sampling and Data Analysis
Unlocking Insights with Descriptive Statistics: A Comprehensive Guide
Unlocking Insights with Data Description: The Key to Effective Analysis
Understanding the Normal Distribution: A Comprehensive Guide
Hypothesis Testing with Two Samples: A Comprehensive Guide
Hypothesis Testing with One Sample: A Comprehensive Guide
Exploring Probability Topics: From Basics to Advanced Strategies
Unlocking the Power of Confidence Intervals: A Comprehensive Guide
Testing Differences: Means, Proportions & Variances

Wendi's Textbook Answer Videos

08:27
Essentials of Modern Business Statistics

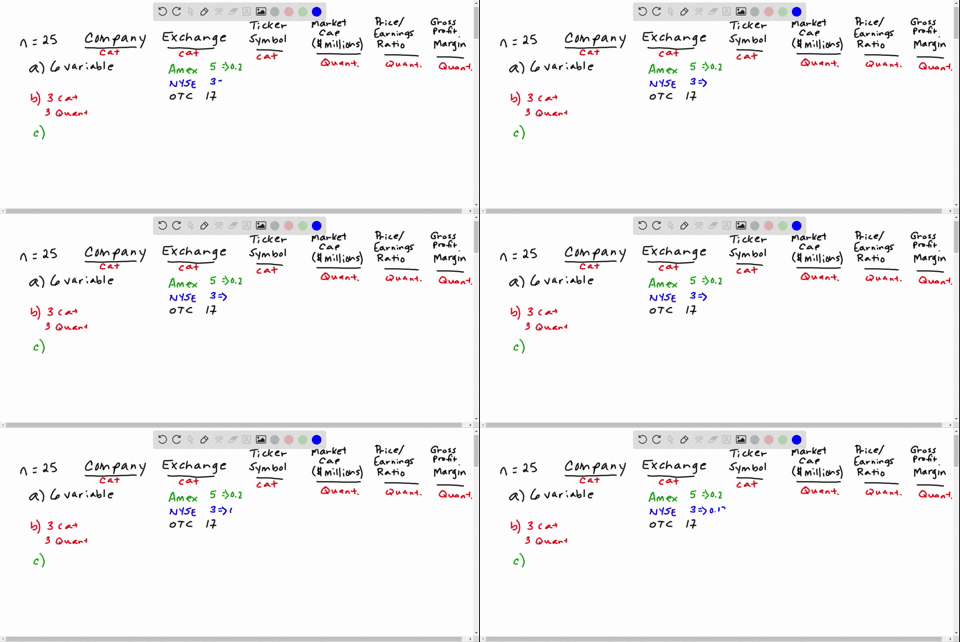
Table 1.8 shows a data set containing information for 25 of the shadow stocks tracked by the American Association of Individual Investors. Shadow stocks are common stocks of smaller companies that are not closely followed by Wall Street analysts. The data set is also on the website that accompanies the text in the file named Shadow 02.
a. How many variables are in the data set?
b. Which of the variables are categorical and which are quantitative?
c. For the Exchange variable, show the frequency and the percent frequency for AMEX, NYSE, and OTC. Construct a bar graph similar to Figure 1.5 for the Exchange variable.
d. Show the frequency distribution for the Gross Profit Margin using the five intervals:
$0-14.9,15-29.9,30-44.9,45-59.9,$ and $60-74.9 .$ Construct a histogram similar to
Figure 1.6 .
e. What is the average price/earnings ratio?

Chapter 1: Data and Statistics
Wendi Obritz
10:13
Essentials of Modern Business Statistics

In 2008 the Better Business Bureau settled 75$\%$ of complaints it received $(U S A$ Today, March $2,2009 ) .$ Suppose you have been hired by the Better Business Bureau to investigate the complaints it received this year involving new car dealers. You plan to select a sample of new car dealer complaints to estimate the proportion of complaints the Better Business Bureau is able to settle. Assume the population proportion of complaints settled for new car dealers is $.75,$ the same as the overall proportion of complaints settled-in $2008 .$
a. Suppose you select a sample of 450 complaints involving new car dealers. Show the sampling distribution of $p .$
b. Based upon a sample of 450 complaints, what is the probability that the sample pro- portion will be within .04 of the population proportion?
c. Suppose you select a sample of 200 complaints involving new car dealers. Show the sampling distribution of $\overline{p} .$
d. Based upon the smaller sample of only 200 complaints, what is the probability that the sample proportion will be within .04 of the population proportion?
e. As measured by the increase in probability, how much do you gain in precision by taking the larger sample in part (b)?

Chapter 7: Sampling and Sampling Distributions
Wendi Obritz
08:36
Statistics

Four hundred draws will be made at random with replacement from the box
$|[1][3][5][7]|$
(a) Estimate the chance that the sum of the draws will be more than $1,500 .$
(b) Estimate the chance that there will be fewer than 90$[3]$ 's.

Chapter 18: The Normal Approximation for Probability Histograms
Wendi Obritz
03:01
Statistics

One kind of plant has only blue flowers and white flowers. According to a genetic model, the offsprings of a certain cross have a 75$\%$ chance to be blue-flowering, and a 25$\%$ chance to be white-flowering, independently of one another. Two hundred seeds of such a cross are raised, and 142 turn out to be blue-flowering. Are the data consistent with the model? Answer yes or no, and explain briefly.

Chapter 26: Tests of Significance
Wendi Obritz
08:09
The Practice of Statistics for AP

To gather data on a 1200-acre pine forest in Louisiana, the U.S. Forest Service laid a grid of 1410 equally spaced circular plots over a map of the forest. A ground survey visited a sample of 10% of these plots.12 (a) Explain how you would use technology or Table D to choose an SRS of 141 plots. Your description should be clear enough for a classmate to obtain your results. (b) Use your method from (a) to choose the first 3 plots.

Chapter 4: Designing Studies
Section 1: Sampling and Surveys
Wendi Obritz
20:01
The Practice of Statistics for AP

Preventing strokes Aspirin prevents blood from clotting and so helps prevent strokes. The Second European Stroke Prevention Study asked whether adding another anticlotting drug, named dipyridamole, would be more effective for patients who had already had a stroke. Here are the data on strokes and deaths during the two years of the study:$^{16}$
$$\begin{array}{ll} &{\text { Number of }} & {\text { Number of }} \\ & {\text { patients }} & {\text { strokes }} \\ \hline \text {Aspirin alone } & 1649 & {206} \\ \text {Aspirin + dipyridamole }& {1650} & {157}\end{array}$$
The study was a randomized comparative experiment.
(a) Is there a significant difference in the proportion of strokes between these two treatments? Carry out an appropriate test to help answer this question.
(b) Describe a Type I and a Type II error in this setting. Which is more serious? Explain.

Chapter 10: Comparing Two Populations or Groups
Section 1: Comparing Two Proportions
Wendi Obritz
1 2 3 4 5 ... 11