JT

Jessie Todd

Numerade Educator
Teacher

Biography

I have been teaching high school math in Oregon for 14 years. I have taught everything from pre-algebra to Calculus.

Education

Jessie has not yet added their education credentials.

Educator Statistics

Numerade tutor for 5 years
31 Students Helped

Topics Covered

Master Trigonometry with Our Comprehensive Guide
Breaking Limits: Unlock Your Potential with Our Expert Solutions
Exploring the World of Derivatives: A Comprehensive Guide

Jessie's Textbook Answer Videos

03:42
Calculus: Early Transcendentals

The graph of $ f $ is given. State, with reasons, the numbers at which $ f $ is $ not $ differentiable.

Chapter 2: Limits and Derivatives
Section 8: The Derivative as a Function
Jessie Todd
10:01
Precalculus: Functions and Graphs

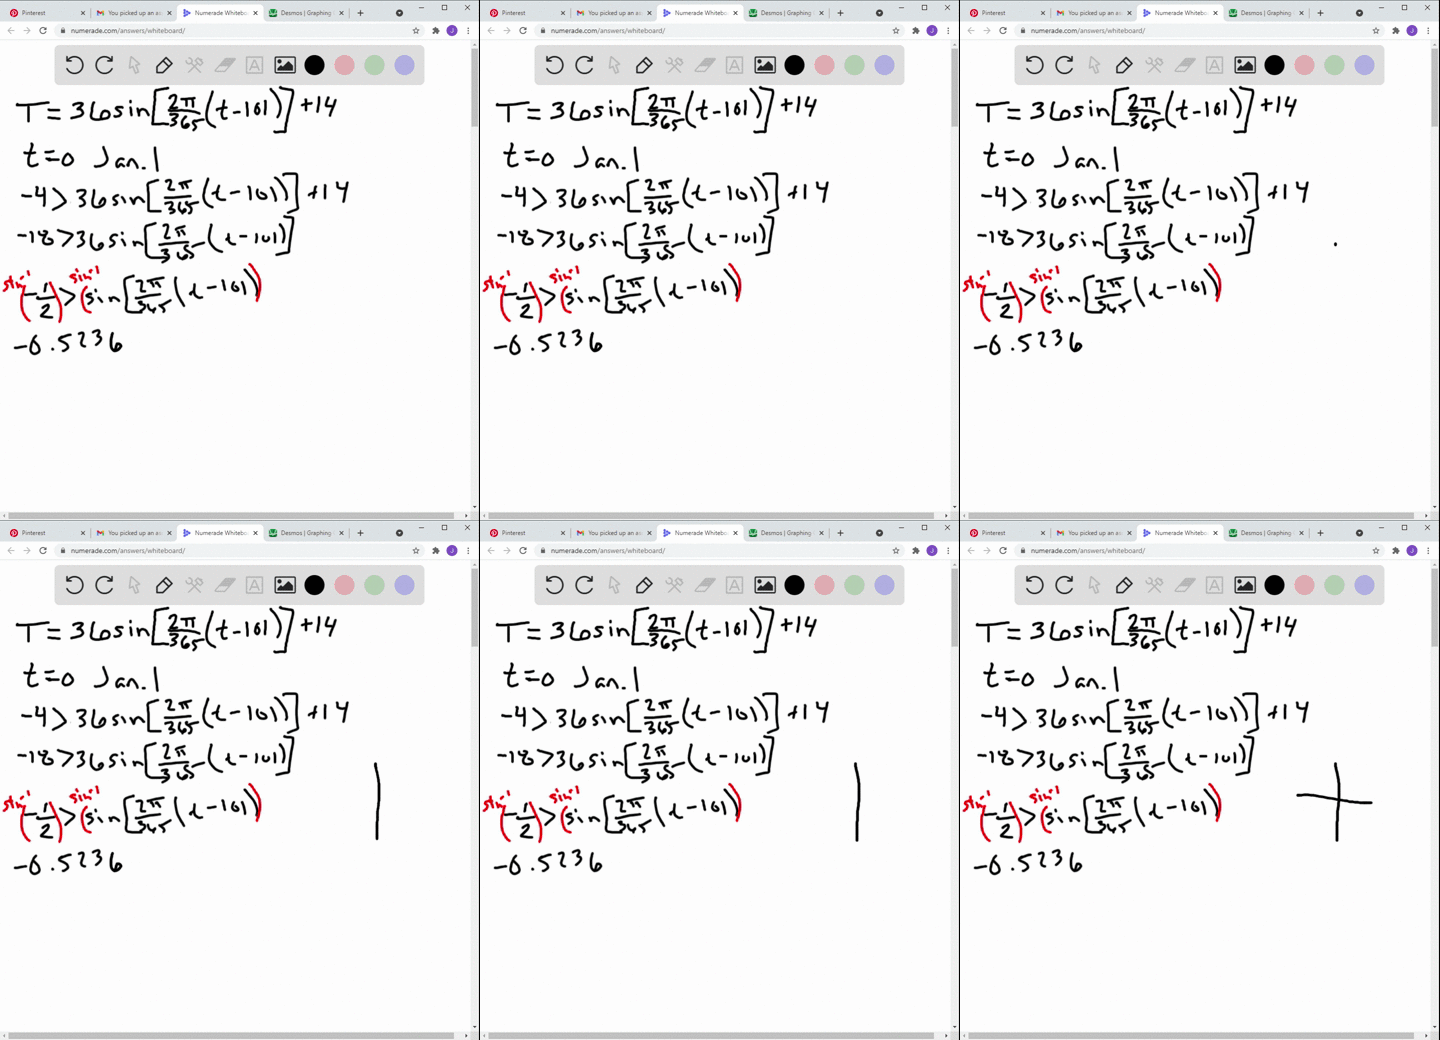
The expected low temperature $T\left(\text { in }^{\circ} \mathrm{F}\right)$ in Fairbanks, Alaska, may be approximated by
$$T=36 \sin \left[\frac{2 \pi}{365}(t-101)\right]+14$$where $\ell$ is in days, with $t=0$ corresponding to January 1 For how many days during the year is the low temperature expected to be below $-4^{\circ} \mathrm{F} ?$

Chapter 6: Analytic Trigonometry
Section 2: Trigonometric Equations
Jessie Todd
06:42
Precalculus: Functions and Graphs

The average monthly high temperature $T\left(\text { in }^{\circ} \mathrm{F}\right)$ in Chicago, Illinois, can be approximated using the function
$$T(t)=26.5 \sin \left(\frac{\pi}{6} t-\frac{2 \pi}{3}\right)+56.5$$
where $l$ is in months and $i=1$ corresponds to January.
(a) Graph $T$ over the two-year interval $[1,25]$
(b) Calculate the average high temperature in July and in October.
(c) Graphically approximate the months when the average high temperature is $69^{\circ} \mathrm{F}$ or higher.
(d) Discuss why a sine function is an appropriate function to approximate these temperatures.

Chapter 6: Analytic Trigonometry
Section 2: Trigonometric Equations
Jessie Todd
05:59
Precalculus: Functions and Graphs

The average monthly high temperature $T$ (in "F) in Augusta, Georgia, can be approximated using the function
$$
T(t)=17 \cos \left(\frac{\pi}{6} t-\frac{7 \pi}{6}\right)+75
$$
where $t$ is in months and $t=1$ corresponds to January.
(a) Graph $T$ over the two-year interval $[1,25]$
(b) Calculate the average high temperature in April and in December.
(c) Graphically approximate the months when the average high temperature is $67^{\circ} \mathrm{F}$ or lower.

Chapter 6: Analytic Trigonometry
Section 2: Trigonometric Equations
Jessie Todd
04:19
Precalculus: Functions and Graphs

On a clear day with $D$ hours of daylight, the intensity of sunlight $I$ (in calories/cm $^{2}$ ) may be approximated by
$$
I=I_{M} \sin ^{3} \frac{\pi t}{D} \quad \text { for } \quad 0 \leq t \leq D
$$
where $t=0$ corresponds to sunrise and $I_{\mathrm{M}}$ is the maximum intensity. If $D=12,$ approximately how many hours after sunrise is $I=\frac{1}{2} I_{\mathrm{M}} ?$

Chapter 6: Analytic Trigonometry
Section 2: Trigonometric Equations
Jessie Todd
1 2 3 4 5

Jessie's Quick Ask Videos

03:43
Calculus 1 / AB

The graph of $ f $ is given. State, with reasons, the numbers at which $ f $ is $ not $ differentiable.

1