02:19
Intro Stats / AP Statistics
DESCRIBING DATA: FREQUENCY TABLES, DISTRIBUTIONS, AND GRAPHIC PRESENTATIONS (10 POINTS)
Please answer the following questions and show graphs if needed.
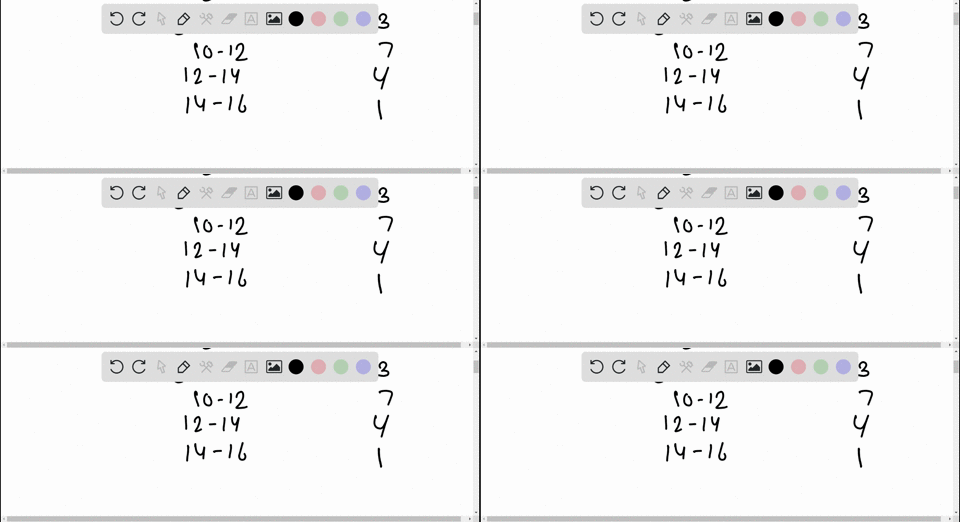
The hourly wages of the 15 employees of Matt's Tire and Auto Repair are organized into the following table.
Hourly Wages
Number of Employees
$8 up to $10 3
$10 up to $12 7
$12 up to $14 4
$14 up to $16 1
(a) What is the table called?
(b) Develop a cumulative frequency distribution and portray the distribution in a cumulative frequency polygon.
(c) On the basis of the cumulative frequency polygon, how many employees earn less than $11 per hour?