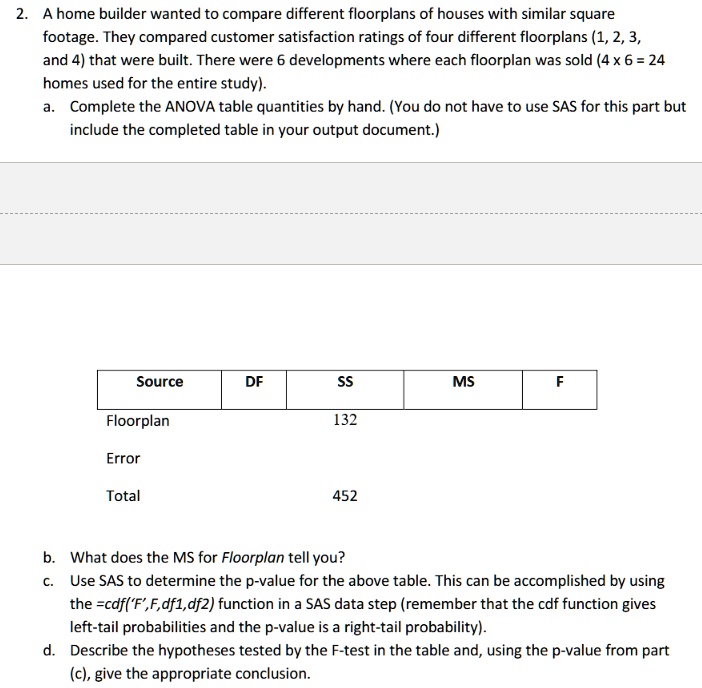
2. A home builder wanted to compare different floorplans of houses with similar square footage. They compared customer satisfaction ratings of four different floorplans (1, 2, 3, and 4 ) that were built. There were 6 developments where each floorplan was sold ( \( 4 \times 6=24 \) homes used for the entire study). a. Complete the ANOVA table quantities by hand. (You do not have to use SAS for this part but include the completed table in your output document.) b. What does the MS for Floorplan tell you? c. Use SAS to determine the \( p \)-value for the above table. This can be accomplished by using the \( =c d f\left({ }^{\prime} F\right. \) ', F, df1,df2) function in a SAS data step (remember that the cdf function gives left-tail probabilities and the \( p \)-value is a right-tail probability). d. Describe the hypotheses tested by the F-test in the table and, using the p-value from part (c), give the appropriate conclusion.
Source
DF
SS
MS
F
Floorplan
132
Error
Total
452