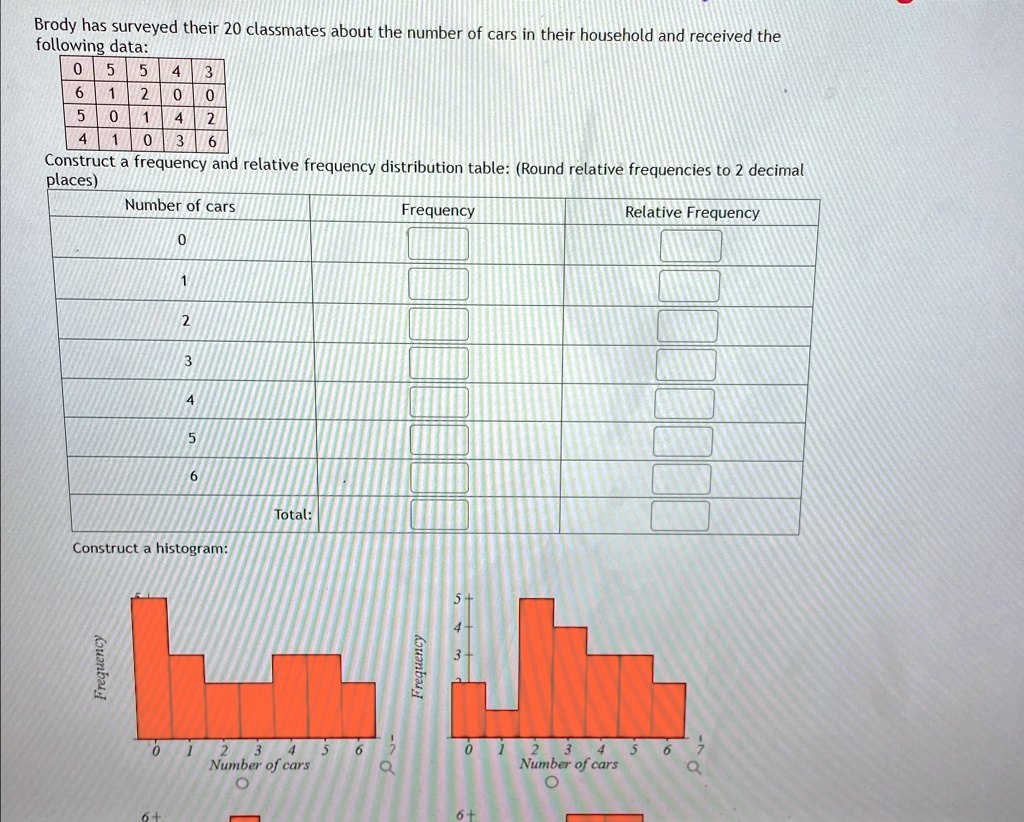
Brody has surveyed their 20 classmates about the number of cars in their household and received the following data:
able[[0,5,5,4,3],[6,1,2,0,0],[5,0,1,4,2],[4,1,0,3,6]]
Construct a frequency and relative frequency distribution table: (Round relative frequencies to 2 decimal places)
able[[Number of cars,Frequency,Relative Frequency,],[0,,,],[1,,,],[2,,,],[3,,,],[4,,,],[5,,,],[6,,,],[,,,]]
Construct a histogram:
Brody has surveyed their 20 classmates about the number of cars in their household and received the following data: 0 5 5 4 3 1 2 0 0 5 0 1 4 2 0 3 6
places) Number of cars
Frequency
Relative Frequency
0
1
2
3
4
5
6
Total:
Construct a histogram:
Frequency
Frequency
0
234 5 Number of cars
6 7 Q
0
234 5 Number of cars
6
Q
64
6+