My library > MAT 240: ... >
2.3: Least squares method
Click this link to download the spreadsheet for use in this activity.
584772 4287074.qx3zqy7
Jump to level 1
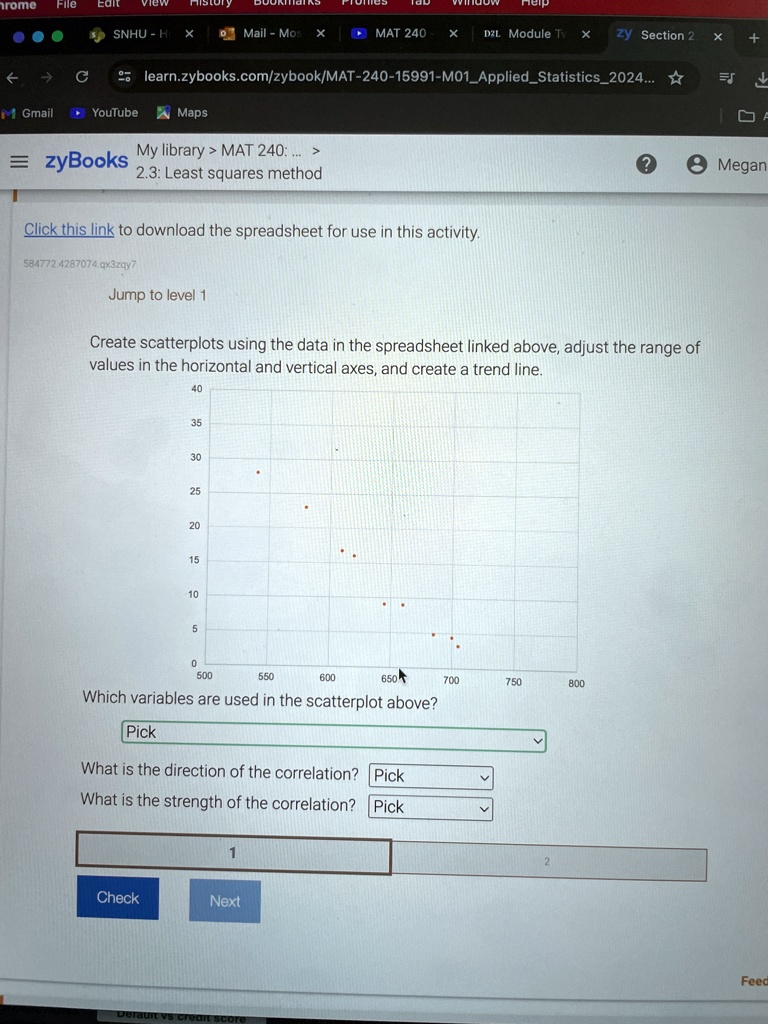
Create scatterplots using the data in the spreadsheet linked above, adjust the range of
values in the horizontal and vertical axes, and create a trend line.
40
35
30
25
20
15
10
5
0
500
550
600
650
700
750
800
Which variables are used in the scatterplot above?
Pick
What is the direction of the correlation?
Pick
What is the strength of the correlation?
Pick
1
Check
Next
2