6:00
56
Stats Part 1
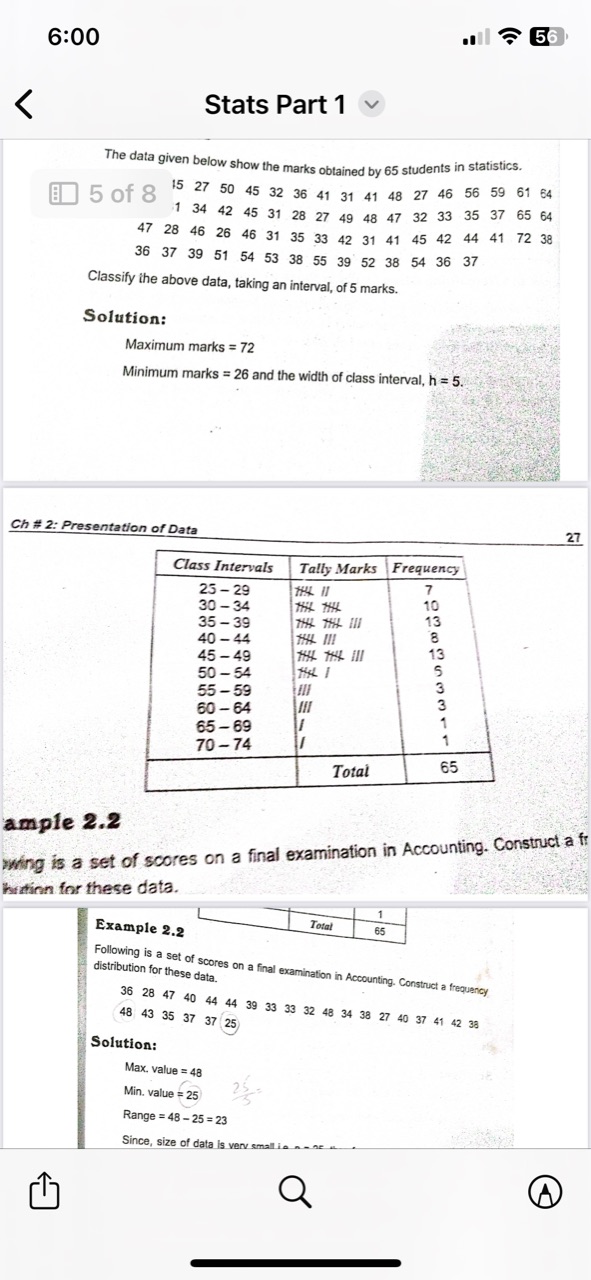
The data given below show the marks obtained by 65 students in statistics.
5 of 8
\begin{tabular}{rrrrrrrrrrrrrrrr}
15 & 27 & 50 & 45 & 32 & 36 & 41 & 31 & 41 & 48 & 27 & 46 & 56 & 59 & 61 & 64 \\
1 & 34 & 42 & 45 & 31 & 28 & 27 & 49 & 48 & 47 & 32 & 33 & 35 & 37 & 65 & 64 \\
28 & 46 & 26 & 46 & 31 & 35 & 33 & 42 & 31 & 41 & 45 & 42 & 44 & 41 & 72 & 38 \\
37 & 39 & 51 & 54 & 53 & 38 & 55 & 39 & 52 & 38 & 54 & 36 & 37 & & &
\end{tabular}
Classify the above data, taking an interval, of 5 marks.
Solution:
Maximum marks \( =72 \)
Minimum marks \( =26 \) and the width of class interval, \( \mathrm{h}=5 \).
Ch\# 2: Presentation of Data
27
\begin{tabular}{|c|c|c|}
\hline Class Intervals & Tally Marks & Frequency \\
\hline \begin{tabular}{l}
\( 25-29 \) \\
\( 30-34 \) \\
\( 35-39 \) \\
\( 40-44 \) \\
\( 45-49 \) \\
\( 50-54 \) \\
\( 55-59 \) \\
\( 60-64 \) \\
\( 65-69 \) \\
\( 70-74 \) \\
\end{tabular} & & \begin{tabular}{c}
7 \\
10 \\
13 \\
8 \\
13 \\
5 \\
3 \\
3 \\
1 \\
1 \\
\end{tabular} \\
\hline & Total & 65 \\
\hline
\end{tabular}
ample 2.2
whing is a set of scores on a final examination in Accounting. Construct a ff hrttinn for these data.
Example 2.2
Following is a set of scores on a final examination in Accounting. Construct a frequency distribution for these data.
\[
\begin{array}{l}
\begin{array}{llllll}
48 & 43 & 35 & 37 & 37 & 25
\end{array} \\
\end{array}
\]
Solution:
\[
\begin{array}{l}
\text { Max. value }=48 \\
\text { Min. value }=25 \\
\text { Range }=48-25=23
\end{array}
\]
Since, size of data is verv small is \( \ldots \)......