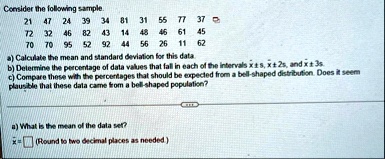
Coesider the following sample.
\table[[21,47,24,39,34,81,31,55,77,37],[72,32,46,82,43,14,48,45,61,45],[70,70,95,52,92,44,56,26,11,62]]
a) Calculate the mean and standard deviation for this data.
b) Determine the percentage of data values that fall in each of the intervals \bar{x} ^(˙) -s,\bar{x} -2s, and \bar{x} -3s.
c) Compare these with the percentages that should be expecled from a bell-shaped distribution. Does it seem plausible that these data came from a bell-shaped population?
a) What is the mean of the data ser?
\bar{x} = ◻ (Round to two decimal places as needed)