Questions asked
Simplify the absolute value 7|cos 𝜃| if 𝜃 = sin−1 x7 for some real number x. (Give your answer in terms of 𝜃.)
Is the demand curve elastic or inelastic at this point? At this point, the demand curve is ▼ inelastic unitary elastic elastic .
Question 35 (2 points) Listen What would be the result of chronic bleeding from gastric carcinoma? Red blood on the surface of the stool Abdominal pain and distension Occult blood in the stool and anemia Hematemesis and shock
Sympatric speciation occurs more commonly in which types of organisms? A) plants B) birds C) insects D) fish E) humans
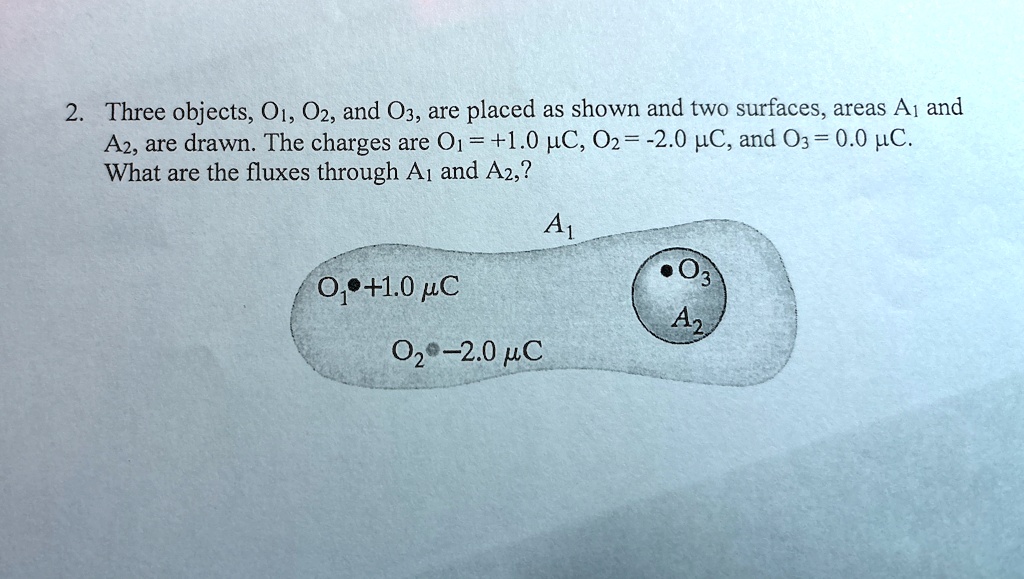
2. Three objects, O1, O2, and O3, are placed as shown and two surfaces, areas A1 and A2, are drawn. The charges are O? = +1.0 µC, O? = -2.0 µC, and O? = 0.0 µC. What are the fluxes through A? and A??
6. Set up, but do not evaluate, an integral representing the arc length of the curve \(r(t) = (\ln t, e^{4t}, t^3)\), where \(1 \le t \le 2\). (5 pts.)
Which of the following components of the osteon contains blood vessels and nerves?
Andrea and Carlos left the airport at the same time. Andrea flew at 190 mph on a course with a bearing of 80°, and Carlos flew at 240 mph on a course with a bearing of 210°. How far apart were they after 6 hours? miles (Round to the nearest tenth.)
7. The Cantril Ladder is a 0-10 scale used to rate life satisfaction. The scatterplot shows a country's national average Cantril Ladder score on the horizontal axis and the GDP per capita on the vertical axis. 15000 30000 45000 60000 GDP Per Capita a. A linear regression model for this data is shown. What assumption is made about the relationship between the Cantril Ladder Score and GDP per capita in a linear model? Cantril Ladder Score 15000 30000 45000 60000 GDP Per Capita b. How well do you think a linear model "fits" this data?
4) Use the sample space from problem 3 to answer the following. a) Find the probability of rolling a sum of 8. b) Find the probability of the first die shows the number 2. c) Find the odds in favor of the sum being 8. d) Find the odds against the first die showing a 2. e) Find the probability the sum is greater than 9. f) Find the odds in favor of the sum being greater than 9. g) Find the probability of not rolling a double (both dice have the same number). h) Find the odds in favor of the sum being an odd number.