PROBLEM #5
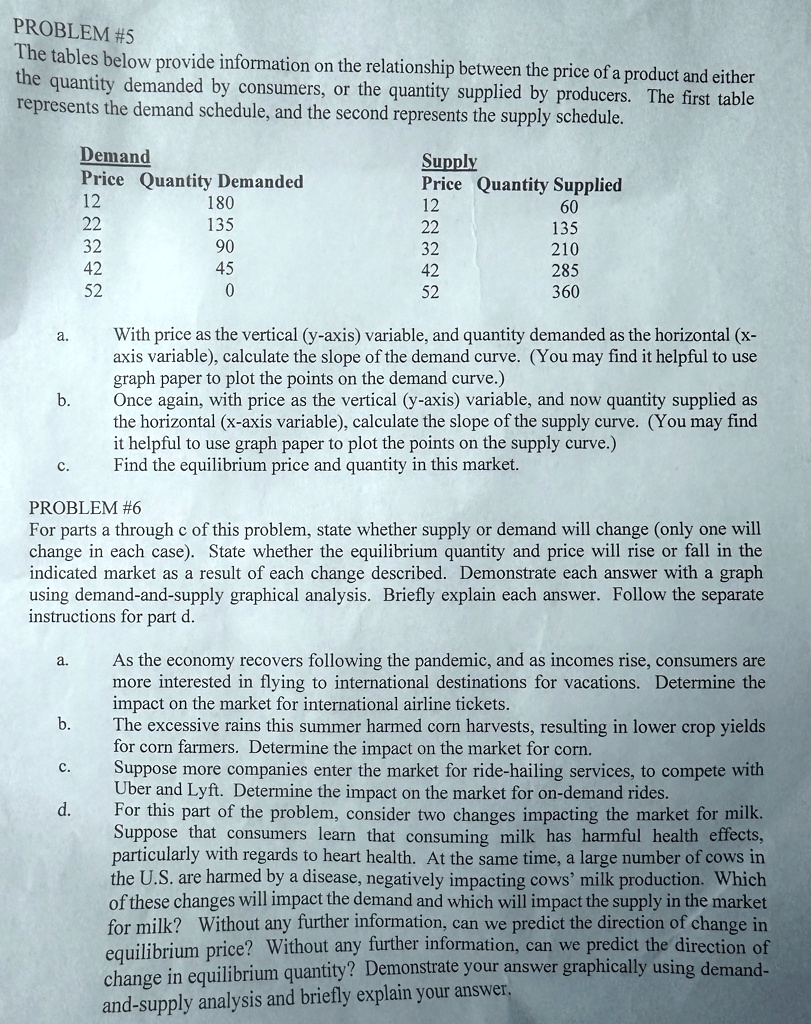
The tables below provide information on the relationship between the price of a product and either
the quantity demanded by consumers, or the quantity supplied by producers. The first table
represents the demand schedule, and the second represents the supply schedule.
Demand
Price Quantity Demanded
12
180
22
135
32
90
42
45
52
0
Supply
Price Quantity Supplied
12
60
22
135
32
210
42
285
52
360
a.
With price as the vertical (y-axis) variable, and quantity demanded as the horizontal (x-
axis variable), calculate the slope of the demand curve. (You may find it helpful to use
graph paper to plot the points on the demand curve.)
b.
Once again, with price as the vertical (y-axis) variable, and now quantity supplied as
the horizontal (x-axis variable), calculate the slope of the supply curve. (You may find
it helpful to use graph paper to plot the points on the supply curve.)
c.
Find the equilibrium price and quantity in this market.
PROBLEM #6
For parts a through c of this problem, state whether supply or demand will change (only one will
change in each case). State whether the equilibrium quantity and price will rise or fall in the
indicated market as a result of each change described. Demonstrate each answer with a graph
using demand-and-supply graphical analysis. Briefly explain each answer. Follow the separate
instructions for part d.
a.
As the economy recovers following the pandemic, and as incomes rise, consumers are
more interested in flying to international destinations for vacations. Determine the
impact on the market for international airline tickets.
b.
The excessive rains this summer harmed corn harvests, resulting in lower crop yields
for corn farmers. Determine the impact on the market for corn.
c.
Suppose more companies enter the market for ride-hailing services, to compete with
Uber and Lyft. Determine the impact on the market for on-demand rides.
d.
For this part of the problem, consider two changes impacting the market for milk.
Suppose that consumers learn that consuming milk has harmful health effects,
particularly with regards to heart health. At the same time, a large number of cows in
the U.S. are harmed by a disease, negatively impacting cows' milk production. Which
of these changes will impact the demand and which will impact the supply in the market
for milk? Without any further information, can we predict the direction of change in
equilibrium price? Without any further information, can we predict the direction of
change in equilibrium quantity? Demonstrate your answer graphically using demand-
and-supply analysis and briefly explain your answer.