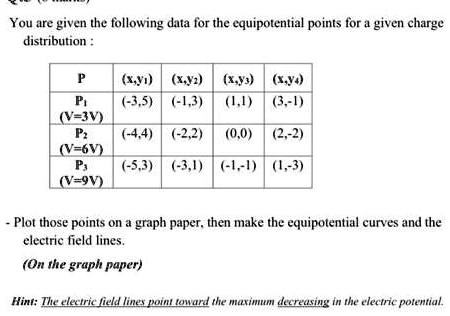
You are given the following data for the equipotential points for a given charge
distribution:
\begin{tabular}{|c|c|c|c|c|}
\hline
P & $(x,y_1)$ & $(x,y_2)$ & $(x,y_3)$ & $(x,y_4)$ \\
\hline
$P_1$ & $(-3,5)$ & $(-1,3)$ & $(1,1)$ & $(3,-1)$ \\
$(V=3V)$ & & & & \\
\hline
$P_2$ & $(-4,4)$ & $(-2,2)$ & $(0,0)$ & $(2,-2)$ \\
$(V=6V)$ & & & & \\
\hline
$P_3$ & $(-5,3)$ & $(-3,1)$ & $(-1,-1)$ & $(1,-3)$ \\
$(V=9V)$ & & & & \\
\hline
\end{tabular}
- Plot those points on a graph paper, then make the equipotential curves and the
electric field lines.
(On the graph paper)
Hint: The electric field lines point toward the maximum decreasing in the electric potential.