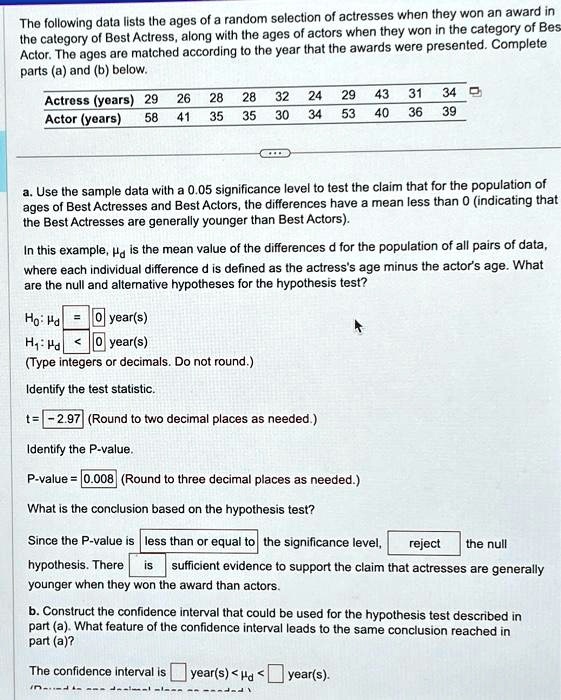
The following data lists the ages of a random selection of actresses when they won an award in
the category of Best Actress, along with the ages of actors when they won in the category of Bes
Actor. The ages are matched according to the year that the awards were presented. Complete
parts (a) and (b) below.
Actress (years) 29 26 28 28 32 24 29 43 31 34
Actor (years) 58 41 35 35 30 34 53 40 36 39
a. Use the sample data with a 0.05 significance level to test the claim that for the population of
ages of Best Actresses and Best Actors, the differences have a mean less than 0 (indicating that
the Best Actresses are generally younger than Best Actors).
In this example, $\mu_d$ is the mean value of the differences $d$ for the population of all pairs of data,
where each individual difference $d$ is defined as the actress's age minus the actor's age. What
are the null and alternative hypotheses for the hypothesis test?
$H_0: \mu_d = 0$ year(s)
$H_1: \mu_d < 0$ year(s)
(Type integers or decimals. Do not round.)
Identify the test statistic.
t = -2.97 (Round to two decimal places as needed.)
Identify the P-value.
P-value = 0.008 (Round to three decimal places as needed.)
What is the conclusion based on the hypothesis test?
Since the P-value is less than or equal to the significance level, reject the null
hypothesis. There is sufficient evidence to support the claim that actresses are generally
younger when they won the award than actors.
b. Construct the confidence interval that could be used for the hypothesis test described in
part (a). What feature of the confidence interval leads to the same conclusion reached in
part (a)?
The confidence interval is $�oxed{}$ year(s) $< \mu_d <$ $�oxed{}$ year(s).