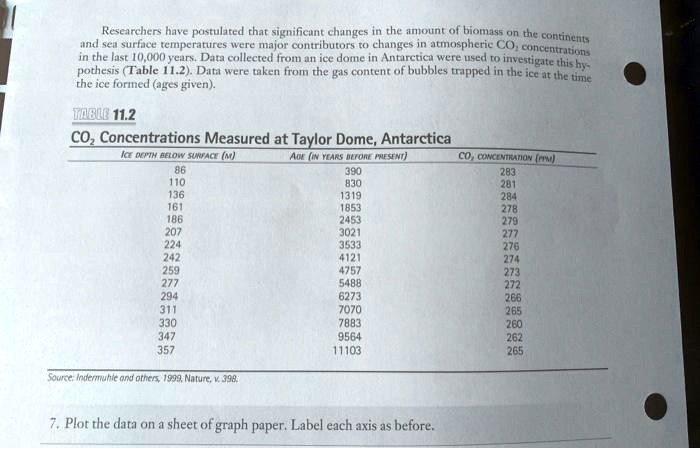
Researchers have postulated that significant changes in the amount of biomass on the continents and sea surface temperatures were major contributors to changes in atmospheric CO$_2$ concentrations in the last 10,000 years. Data collected from an ice dome in Antarctica were used to investigate this hypothesis (Table 11.2). Data were taken from the gas content of bubbles trapped in the ice at the time the ice formed (ages given).
TABLE 11.2
CO$_2$ Concentrations Measured at Taylor Dome, Antarctica
ICE DEPTH BELOW SURFACE (m)
AGE (IN YEARS BEFORE PRESENT)
CO$_2$ CONCENTRATION (ppm)
86
390
283
110
830
281
136
1319
284
161
1853
278
186
2453
279
207
3021
277
224
3533
276
242
4121
274
259
4757
273
277
5488
272
294
6273
266
311
7070
265
330
7883
260
347
9564
262
357
11103
265
Source: Indermuhle and others, 1999, Nature, v. 398.
7. Plot the data on a sheet of graph paper. Label each axis as before.