Pls explain and answer a,b and c. a. Error sum of squares, total sum of squares, regression sum of squares / 37.778, 5.7185, 43.7120
c. Error sum of squares, total sum of squares, regression sum of squares / 37.778, 5.7185, 43.7120
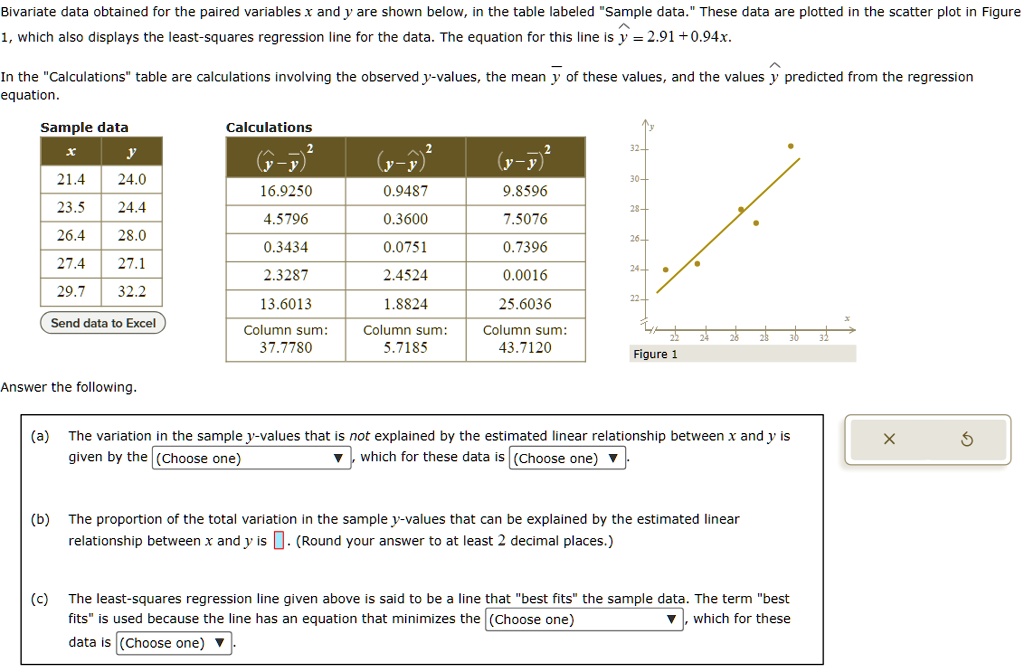
Bivariate data obtained for the paired variables x and y are shown below, in the table labeled "Sample data."These data are plotted in the scatter plot in Figure
1, which also displays the least-squares regression line for the data. The equation for this line is y=2.91+0.94x.
In the "Calculations" table are calculations involving the observed y-values, the mean y of these values, and the values y predicted from the regression equation.
Sample data
Calculations
x
(y-y 16.9250
y
21.4 23.5 26.4 27.4 29.7
24.0 24.4
0.9487
9.8596
30.
4.5796
0.3600
7.5076
28.
28.0
0.3434
0.0751
0.7396
27.1
2.3287
2.4524
0.0016
32.2
13.6013 Column sum: 37.7780
1.8824
25.6036 Column sum: 43.7120
Send data to Excel
Column sum: 5.7185
Figure 1
Answer the following.
(a) The variation in the sample y-values that is not explained by the estimated linear relationship between x and y is given by the(Choose one) , which for these data is(Choose one)
X
G
(b) The proportion of the total variation in the sample y-values that can be explained by the estimated linear relationship between x and y is(Round your answer to at least 2 decimal places.
(c) The least-squares regression line given above is said to be a line that "best fits" the sample data. The term "best fits" is used because the line has an equation that minimizes the(Choose one) v, which for these data is(Choose one)