2. Create a sheet titled “PG”. First, without the use of functions average() and stdev(), compute
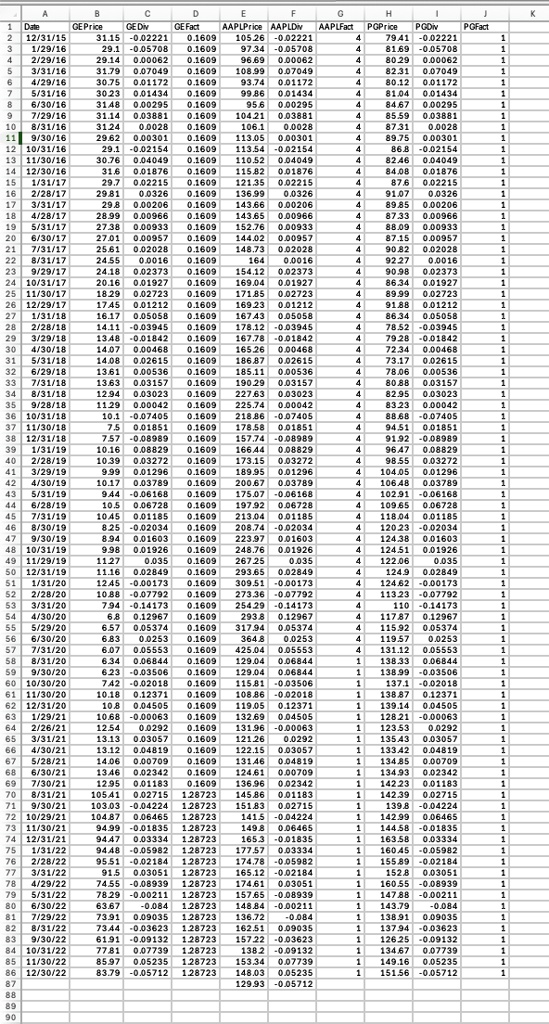
the average and the std. deviation of PG’s returns. Copy the dates and PG returns from
“ReturnData” into the sheet, sum the return column and divide by the number of observations
(=84) to get the mean Ravg. Create a column with (Rt -Ravg)2, sum it, divide by the number of
observations minus one (=83), take a square root (sqrt()) of the result to get the st. deviation.
Verify next to it that the Excel functions average() and stdev() give identical answers.
3. Create a sheet “PortfolioReturns” (like “ReturnData”) in which you generate returns on
portfolios with the follwng respective weights for the three stocks: (30, 20, 50), (25, 45, 30),
(50, 40, 10), (33 1/3, 33 1/3, 33 1/3), (50, 25, 25), (25, 50, 25), (25, 25, 50), (10, 20, 70), (20,
10, 70), (70, 20, 10). For example, (25, 50, 25) means that you put 25% in GE, 50% in AAPL
and 25% in PG. Prepend a column of dates and three columns of individual stock returns.
Append a column with Index returns. You end up with 15 columns: Date, the three stocks,
the 10 portfolios labeled P1-P10, and Index. Dates Jan 2016 to Dec 2022, i.e. 84 rows. At the
bottom of each return column compute the mean and the st. dev. of monthly returns using
functions AVERAGE() and STDEV(). Note: 33.3333 != 33 1/3. Enter (1/3), not 0.3333.
4. Create a sheet “Frontier”. Copy the results from 3. into a transposed 14rows x 3cols table.
Columns are: portfolio label, stdev, mean. Rows are the 14 assets. Create an efficient frontier
graph with mean on the Y-axis and st. deviation on the X-axis. Use “XY Scatter” from the
graph menu. Each portfolio should be represented by a labeled dot. Draw a rough guess of
the Eff Frontier using the Draw Tool/Shapes. Add the risk free (TBill) rate of 0.1%=0.0010,
and add the rough guess of the Capital Market Line which goes through point (0, 0.1%) and
is tangent to the efficient frontier (eyeball roughly, don’t try to be exact). You can do this last
part (CML) also by hand/i.e. using the draw tool.
5.
a. Create a sheet “Regressions”. Copy the date column from “ReturnData” into Col A.
From the 2024FallTBills.xlsx file copy 84 T-bill rates for the correct months (match
months only), switch dates order to match, divide by 1200 to convert annual to
monthly and to %, reformat to %. Place the result in Col B. Add 4 cols C-F in which
you compute the excess returns on (the three stocks and Index) minus the TBill rates.
b. Create a sheet “Beta”. Repeatedly (3 times), use the regression function in Excel to
compute betas for the three stocks. Regression can be found in Excel under Data ->
Data Analysis; scroll to Regression. If it doesn’t appear, go to Office icon -> Excel
options -> Add-ins, and add the Analysis Tool pack. Use a DESB computer if your
home one lacks this function. In the regression window, Y-variable is the column
range of stock excess returns, the X-variable is always the column range of excess
MKT Index returns. Beta will be the slope coefficient in the output range. (It will be
labeled “XVariable” if you don’t include header row). In “ReturnData”, add a row
labeled Beta at the bottom. Copy the tree betas. Add the market beta for Index (=?
think a little:-). Compute the 10 betas for the portfolios by weighting the stock betas.
6.
a. Create a sheet “SML”. Copy the 14 betas from Part-5b into a column. Copy the
corresponding 14 return means from Part 3 into another column. Append a row in the table
for TBill with its mean 0.1%=0.0010 and beta=0. Prepend a col of labels.
b. Create two new sheets. As in Part 1 and 2, create 13 rows of monthly price data for GE,
AAPL and PG from Dec 2022 to Dec 2023 into a new sheet “NewPriceData”. Compute 12
rows of returns from Jan 2023 to Dec 2023 (13 prices 12 returns) for the four securities
(GE, AAPL, PG, Index) in “NewReturnData”. Add 10 columns for Portfolios 1-10 and
compute their returns. As before, at the bottom of the “NewReturnData” compute the means
and st. deviations for the four securities and the 10 portfolios.
c. Overwrite the old means for the stocks, the MKT, and the portfolios in the “SML” sheet
with the new means. (We have the betas predicted by the 2016-2022 data, but the realized
mean returns for 2023). Also copy/overwrite the TBills 2023 mean with 0.4234%=0.004234.
d. Plot the (new) mean returns against (old) betas on a graph using “XY Scatter” with Y-axis
as the mean and X-axis as beta. Label your stocks and portfolios. Use the Draw tool to trace
the Security Market Line through TBill and Index.