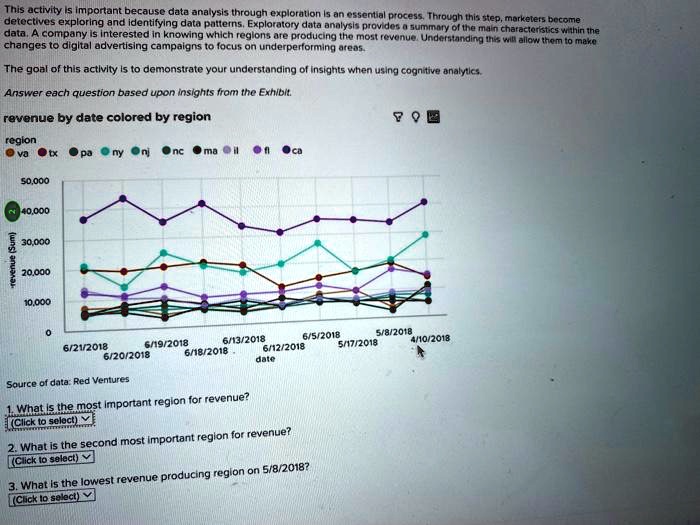
This activity is important because data analysis through exploration is an essential process. Through this step, marketers become
detectives exploring and identifying data patterns. Exploratory data analysis provides a summary of the main characteristics within the
data. A company is interested in knowing which regions are producing the most revenue. Understanding this will allow them to make
changes to digital advertising campaigns to focus on underperforming areas.
The goal of this activity is to demonstrate your understanding of insights when using cognitive analytics.
Answer each question based upon insights from the Exhibit.
revenue by date colored by region
region
va tx pa ny nj nc ma il fi ca
50,000
40,000
30,000
revenue (Sum)
20,000
10,000
0
6/21/2018 6/20/2018 6/19/2018 6/18/2018 6/13/2018 6/12/2018 6/5/2018 5/17/2018 5/8/2018 4/10/2018
date
Source of data: Red Ventures
1. What is the most important region for revenue?
(Click to select)
2. What is the second most important region for revenue?
(Click to select)
3. What is the lowest revenue producing region on 5/8/2018?
(Click to select)