s.auckland.ac.nz/cours...
Maps
Canvas
Microsoft 365
spotify
Pay
Paused
Update
Pay careful attention to the rounding specified for any answers calculated from data.
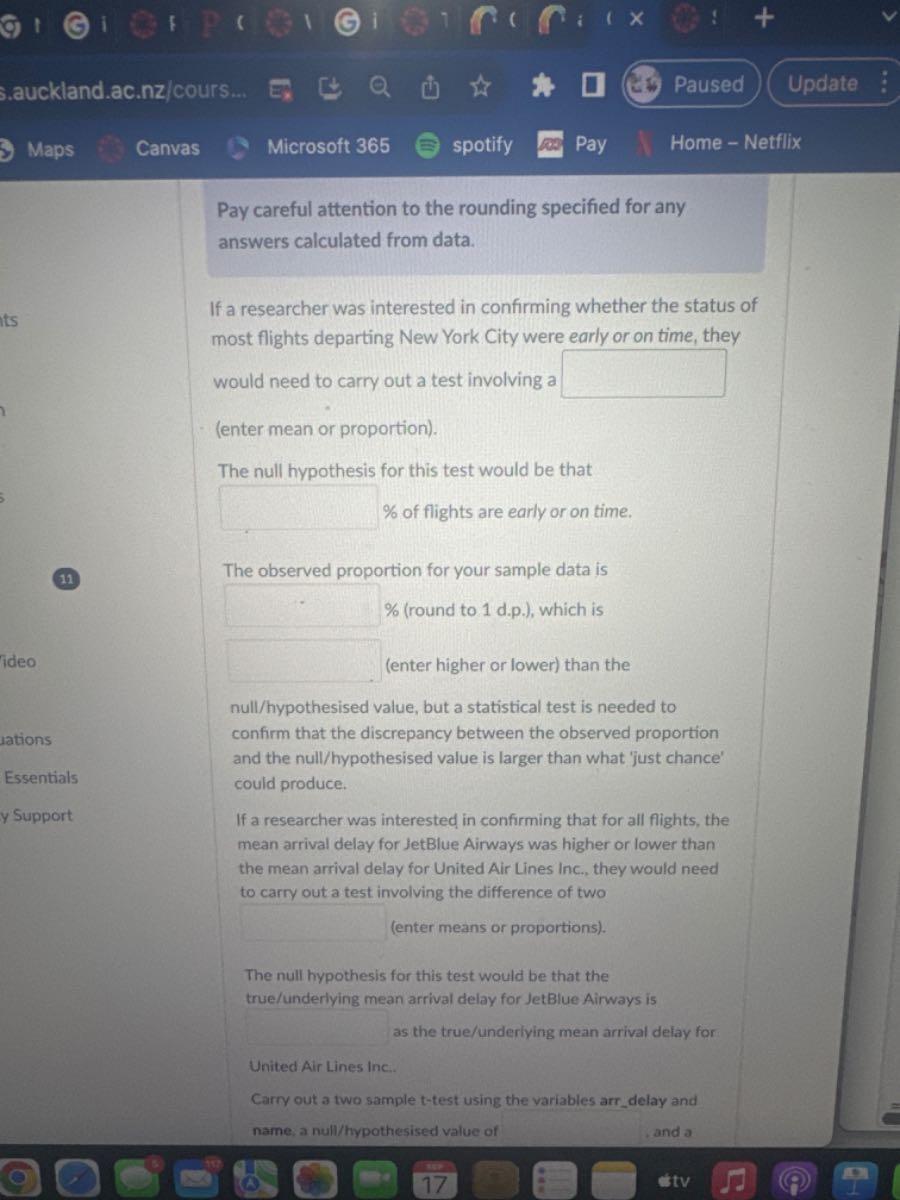
If a researcher was interested in confirming whether the status of most flights departing New York City were early or on time, they would need to carry out a test involving a \( \square \) (enter mean or proportion).
The null hypothesis for this test would be that \( \square \) \( \% \) of flights are early or on time.
12
The observed proportion for your sample data is \( \square \) \( \% \) (round to 1 d.p.), which is
ideo
\( \square \) (enter higher or lower) than the null/hypothesised value, but a statistical test is needed to confirm that the discrepancy between the observed proportion and the null/hypothesised value is larger than what 'just chance' could produce.
If a researcher was interested in confirming that for all flights, the mean arrival delay for JetBlue Airways was higher or lower than the mean arrival delay for United Air Lines Inc., they would need to carry out a test involving the difference of two \( \square \)
(enter means or proportions).
The null hypothesis for this test would be that the true/underlying mean arrival delay for JetBlue Airways is as the true/underlying mean arrival delay for United Air Lines Inc.
Carry out a two sample \( t \)-test using the variables arr_delay and
name, a null/hypothesised value of
and a