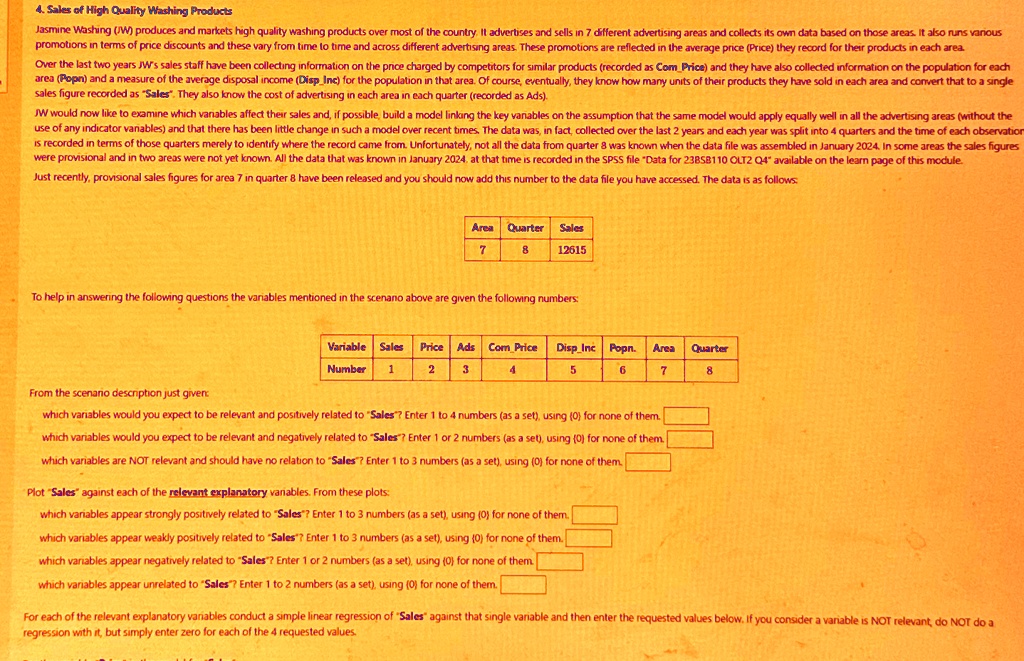
Sales of High-Quality Washing Products sales figure recorded as "Sales". They also know the cost of advertising in each area in each quarter (recorded as Ads).
Just recently, provisional sales figures for area 7 in quarter 8 have been released, and you should now add this number to the data file you have accessed. The data is as follows:
able[[Area,Quarter,Sales],[7,8,12615]]
To help in answering the following questions, the variables mentioned in the scenario above are given the following numbers:
able[[Variable,Sales,Price,Ads,Com_Price,Disp_Inc,Popn.,Area,Quarter],[Number,1,2,3,4,5,6,7,8]]
From the scenario description just given:
which variables would you expect to be relevant and positively related to "Sales"? Enter 1 to 4 numbers (as a set), using {0} for none of them.
which variables would you expect to be relevant and negatively related to "Sales? Enter 1 or 2 numbers (as a set), using {0} for none of them.
which variables are NOT relevant and should have no relation to "Sales"? Enter 1 to 3 numbers (as a set), using {0} for none of them.
Plot "Sales" against each of the relevant explanatory variables. From these plots:
which variables appear strongly positively related to "Sales"? Enter 1 to 3 numbers (as a set), using {0} for none of them.
which variables appear weakly positively related to "Sales"? Enter 1 to 3 numbers (as a set), using {0} for none of them.
which variables appear negatively related to "Sales"? Enter 1 or 2 numbers (as a set), using {0} for none of them.
Which variables appear unrelated to "Sales"? Enter 1 to 2 numbers (as a set), using {0} for none of them regression with it, but simply enter zero for each of the 4 requested values.
Sales of High-Quality Washing Products Jasmine Washing rW produces and markets high-quality washing products over most of the country. It advertises and sells in 7 different advertising areas and collects its data based on those areas. It also runs various promotions in terms of price discounts, and these vary from time to time and across different advertising areas. These promotions are reflected in the average price (Price they record for their products in each area). Over the last two years, JW's sales staff have been collecting information on the price charged by competitors for similar products (recorded as Com_Price), and they have also collected information on the population for each area (Popn) and a measure of the average disposal income (Disp_Inc) for the population in that area. Of course, eventually, they know how many units of their products they have sold in each area and convert that to a single sales figure recorded as "Sales". They also know the cost of advertising in each area in each quarter (recorded as Ads). JW would now like to examine which variables affect their sales and, if possible, build a model linking the key variables on the assumption that the same model would apply equally well in all the advertising areas (without the use of any indicator variables and that there has been little change in such a model over recent times. The data was, in fact, collected over the last 2 years, and each year was split into 4 quarters, and the time of each observation is recorded in terms of those quarters merely to identify where the record came from. Unfortunately, not all the data from quarter 8 was known when the data file was assembled in January 2024. In some areas, the sales figures were provisional and in two areas were not yet known. All the data that was known in January 2024 at that time is recorded in the SPSS file Data for 23BSB110 OLT2 Q4 available on the learn page of this module. Just recently, provisional sales figures for area 7 in quarter 8 have been released, and you should now add this number to the data file you have accessed. The data is as follows:
Area
Quarter
Sales
7
8
12615
To help in answering the following questions, the variables mentioned in the scenario above are given the following numbers:
Variable
Price ads Com_Price
Disp_Inc
Popn.
Quarter 8
Number
2
3
6
From the scenario description just given:
which variables would you expect to be relevant and positively related to Sales? Enter 1 to 4 numbers (as a set), using {0} for none of them. which variables would you expect to be relevant and negatively related to Sales? Enter 1 or 2 numbers (as a set), using {0} for none of them. which variables are NOT relevant and should have no relation to Sales? Enter 1 to 3 numbers as a set, using {0} for none of them
Plot Sales against each of the relevant explanatory variables. From these plot:
which variables appear strongly positively related to Sales? Enter 1 to 3 numbers as a set, using {0} for none of them
which variables appear negatively related to Sales? Enter 1 or 2 numbers as a set, using {0} for none of them
which variables appear unrelated to Sales? Enter 1 to 2 numbers as a set, using {0} for none of them.
regression with it, but simply enter zero for each of the 4 requested values.