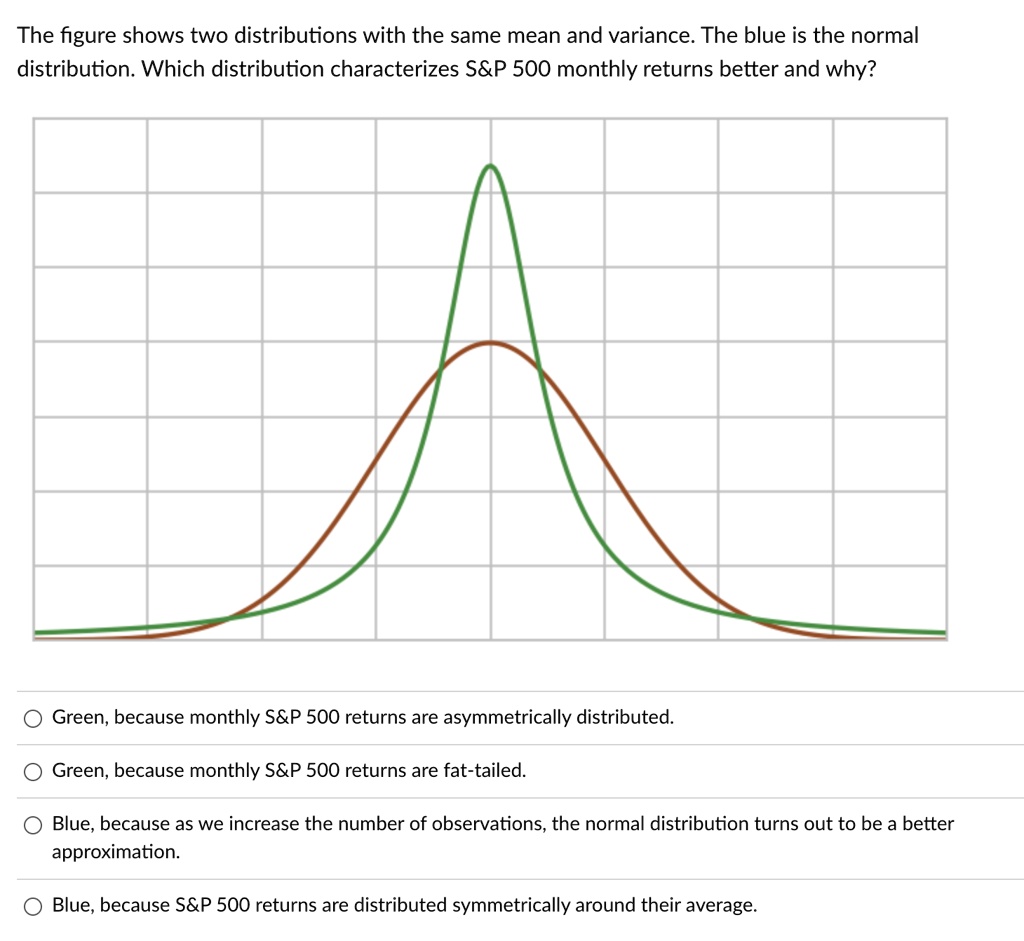
The figure shows two distributions with the same mean and variance. The blue is the normal
distribution. Which distribution characterizes S&P 500 monthly returns better and why?
Green, because monthly S&P 500 returns are asymmetrically distributed.
Green, because monthly S&P 500 returns are fat-tailed.
Blue, because as we increase the number of observations, the normal distribution turns out to be a better
approximation.
Blue, because S&P 500 returns are distributed symmetrically around their average.