Ace - AI Tutor
Ask Our Educators
Textbooks
My Library
Flashcards
Scribe - AI Notes
Notes & Exams
Download App
Ali Isa

Ali I.

Divider

Questions asked

INSTANT ANSWER

3ack to Assignment Attempts \( \square \) Average / 2 8. Total economic surplus The following graph plots the supply and demand curves in the market for motor scooters. Use the black point (plus symbol) to indicate the equilibrium price and quantity of motor scooters. Then use the green point (triangle symbol) to fill the area representing consumer surplus, and use the purple point (diamond symbol) to fill the area representing producer surplus. Total surplus in this market is \( \qquad \) million. Grade It Now Save \& Continue Continue without saving

View Answer
divider
ANSWERED

Anand Jangid verified

Numerade educator

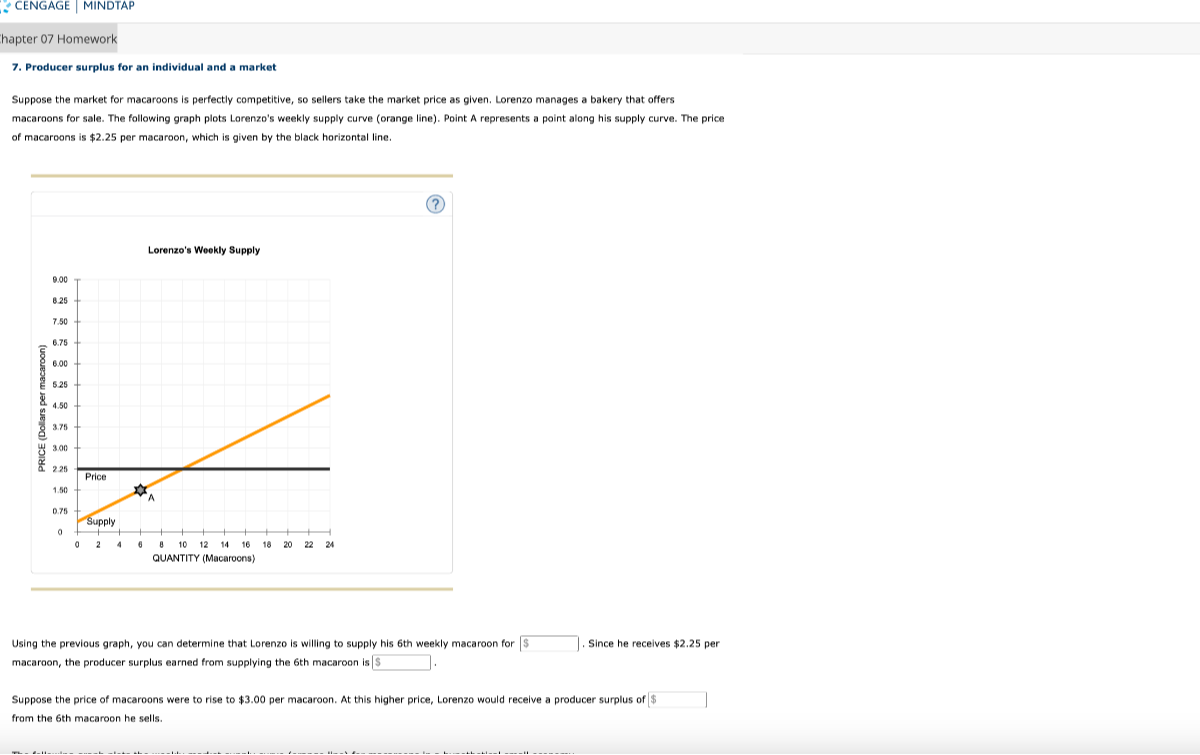
CENGAGE MINDTAP Chapter 07 Homework 7. Producer surplus for an individual and a market Suppose the market for macaroons is perfectly competitive, so sellers take the market price as given. Lorenzo manages a bakery that offers macaroons for sale. The following graph plots Lorenzo's weekly supply curve (orange line). Point A represents a point along his supply curve. The price of macaroons is $2.25 per macaroon, which is given by the black horizontal line. Lorenzo's Weekly Supply Price (Dollars per macaroon) 4.50 4.00 3.50 3.00 2.50 2.00 1.50 1.00 0.50 0 0 1 2 3 4 5 6 7 8 9 10 Quantity (Macaroons per week) Using the previous graph, you can determine that Lorenzo is willing to supply his 6th weekly macaroon for $. Since he receives $2.25 per macaroon, the producer surplus earned from supplying the 6th macaroon is $. Suppose the price of macaroons were to rise to $3.00 per macaroon. At this higher price, Lorenzo would receive a producer surplus of $ from the 6th macaroon he sells.
View Answer
divider
INSTANT ANSWER

The following graph plots a supply curve (orange line) for a group of recent graduates looking to sell used motor scooters. Each seller has only a single used scooter available for sale. Think of each rectangular area beneath the supply curve as the "cost," or minimum price that each seller is willing to accept. Assume that anyone who has a cost that equals the market price is willing to sell their used scooter. Region \( \mathrm{X} \) (the purple shaded area) represents total producer surplus when the market price is equal to \( \$ \), while Region \( Y \) (the grey shaded area) represents \( \qquad \) when the market price \( \qquad \) In the following table, Indicate which statements are true or false based on the information provided on the previous graph. \begin{tabular}{|l|l|} \hline Statement & True False \\ \hline Assuming each seller receives a positive surplus, Lucia will always receive less producer surplus than Paolo. \\ \hline Producer surplus is larger when the price is \( \$ 140 \) than when it is \( \$ 100 \). & \\ \hline \end{tabular} In order for Amy to earn a producer surplus of exactly \( \$ 40 \) from selling a used scooter, the market price must be \( \square \) \( \$ \) .

View Answer
divider