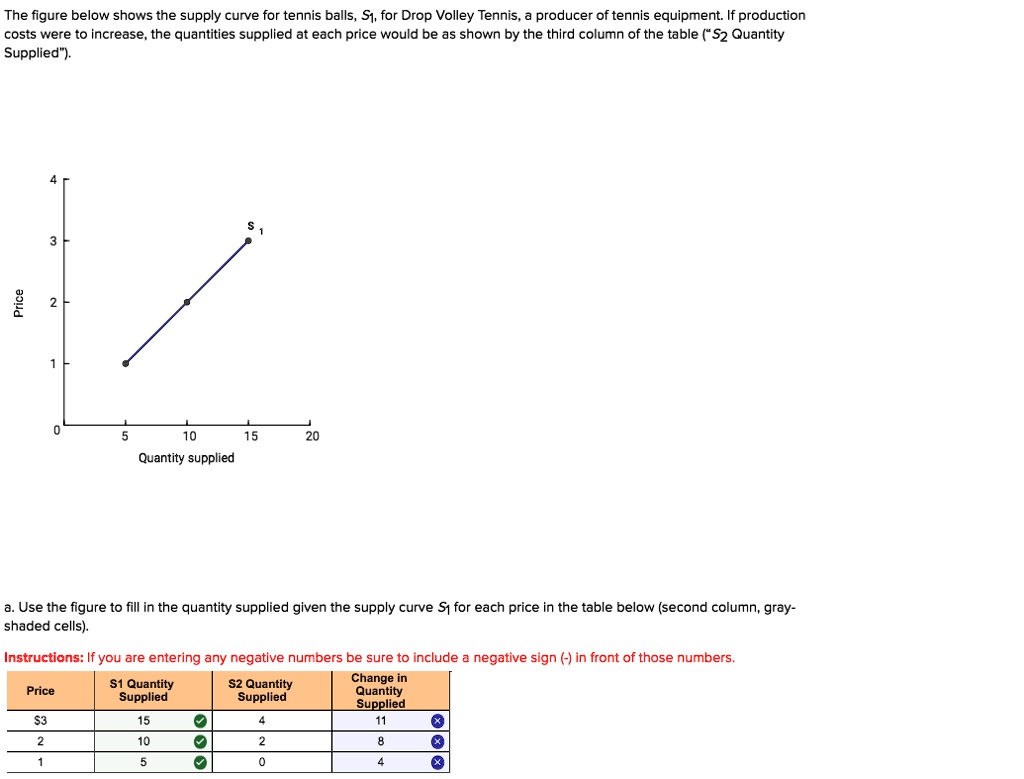
The figure below shows the supply curve for tennis balls, S1, for Drop Volley Tennis, a producer of tennis equipment. If production costs were to increase, the quantities supplied at each price would be as shown by the third column of the table ("S2 Quantity Supplied").
Price | Quantity supplied
4
3 | S1
2
1
0 | 5 | 10 | 15 | 20
a. Use the figure to fill in the quantity supplied given the supply curve S1 for each price in the table below (second column, gray-shaded cells).
Instructions: If you are entering any negative numbers be sure to include a negative sign (-) in front of those numbers.
Price | S1 Quantity Supplied | S2 Quantity Supplied | Change in Quantity Supplied
$3 | 15 | 4 | 11
2 | 10 | 2 | 8
1 | 5 | 0 | 4