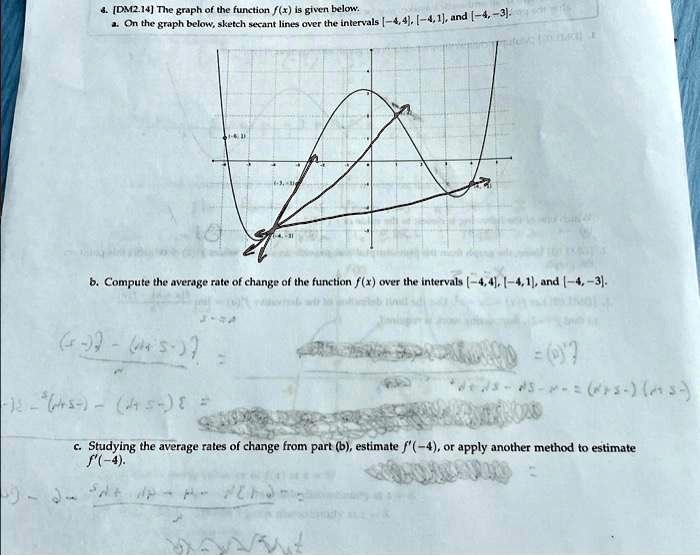
4. [DM2.14] The graph of the function $f(x)$ is given below.
a. On the graph below, sketch secant lines over the intervals $[-4, 4]$, $[-4, 1]$, and $[-4, -3]$.
b. Compute the average rate of change of the function $f(x)$ over the intervals $[-4, 4]$, $[-4, 1]$, and $[-4, -3]$.
c. Studying the average rates of change from part (b), estimate $f'(-4)$, or apply another method to estimate $f'(-4)$.