Ace - AI Tutor
Ask Our Educators
Textbooks
My Library
Flashcards
Scribe - AI Notes
Notes & Exams
Download App
Allan Hernández

Allan H.

Divider

Viewed Questions

According to statistics reported on CNBC, a surprising number of motor vehicles are not
covered by insurance $(\mathrm{CN} \mathrm{BC},$ February $23,2006) .$ Sample results, consistent with the $\mathrm{CNBC}$ report, showed 46 of 200 vehicles were not covered by insurance.
$$\begin{array}{l}{\text { a. What is the point estimate of the proportion of vehicles not covered by insurance? }} \\ {\text { b. Develop a } 95 \% \text { confidence interval for the population proportion. }}\end{array}$$

According to statistics reported on CNBC, a surprising number of motor vehicles are not covered by insurance $(\mathrm{CN} \mathrm{BC},$ February $23,2006) .$ Sample results, consistent with the $\mathrm{CNBC}$ report, showed 46 of 200 vehicles were not covered by insurance. $$\begin{array}{l}{\text { a. What is the point estimate of the proportion of vehicles not covered by insurance? }} \\ {\text { b. Develop a } 95 \% \text { confidence interval for the population proportion. }}\end{array}$$

Essentials of Modern Business Statistics

Questions asked

INSTANT ANSWER

Use the change of quantifier rule together with the eighteen rules of inference to derive the conclusions of the following symbolized argument. Do not use either conditional proof or indirect proof. NOTE: Throughout, in the proof checker tool, CQ, which stands for Change of Quantifier Rule, is used instead of QN, which stands for Quantifier Negation Rule. Please remember to use \( \mathbf{C Q} \) whenever you wish to apply the Quantifier Negation Rule, QN.

View Answer
divider
INSTANT ANSWER

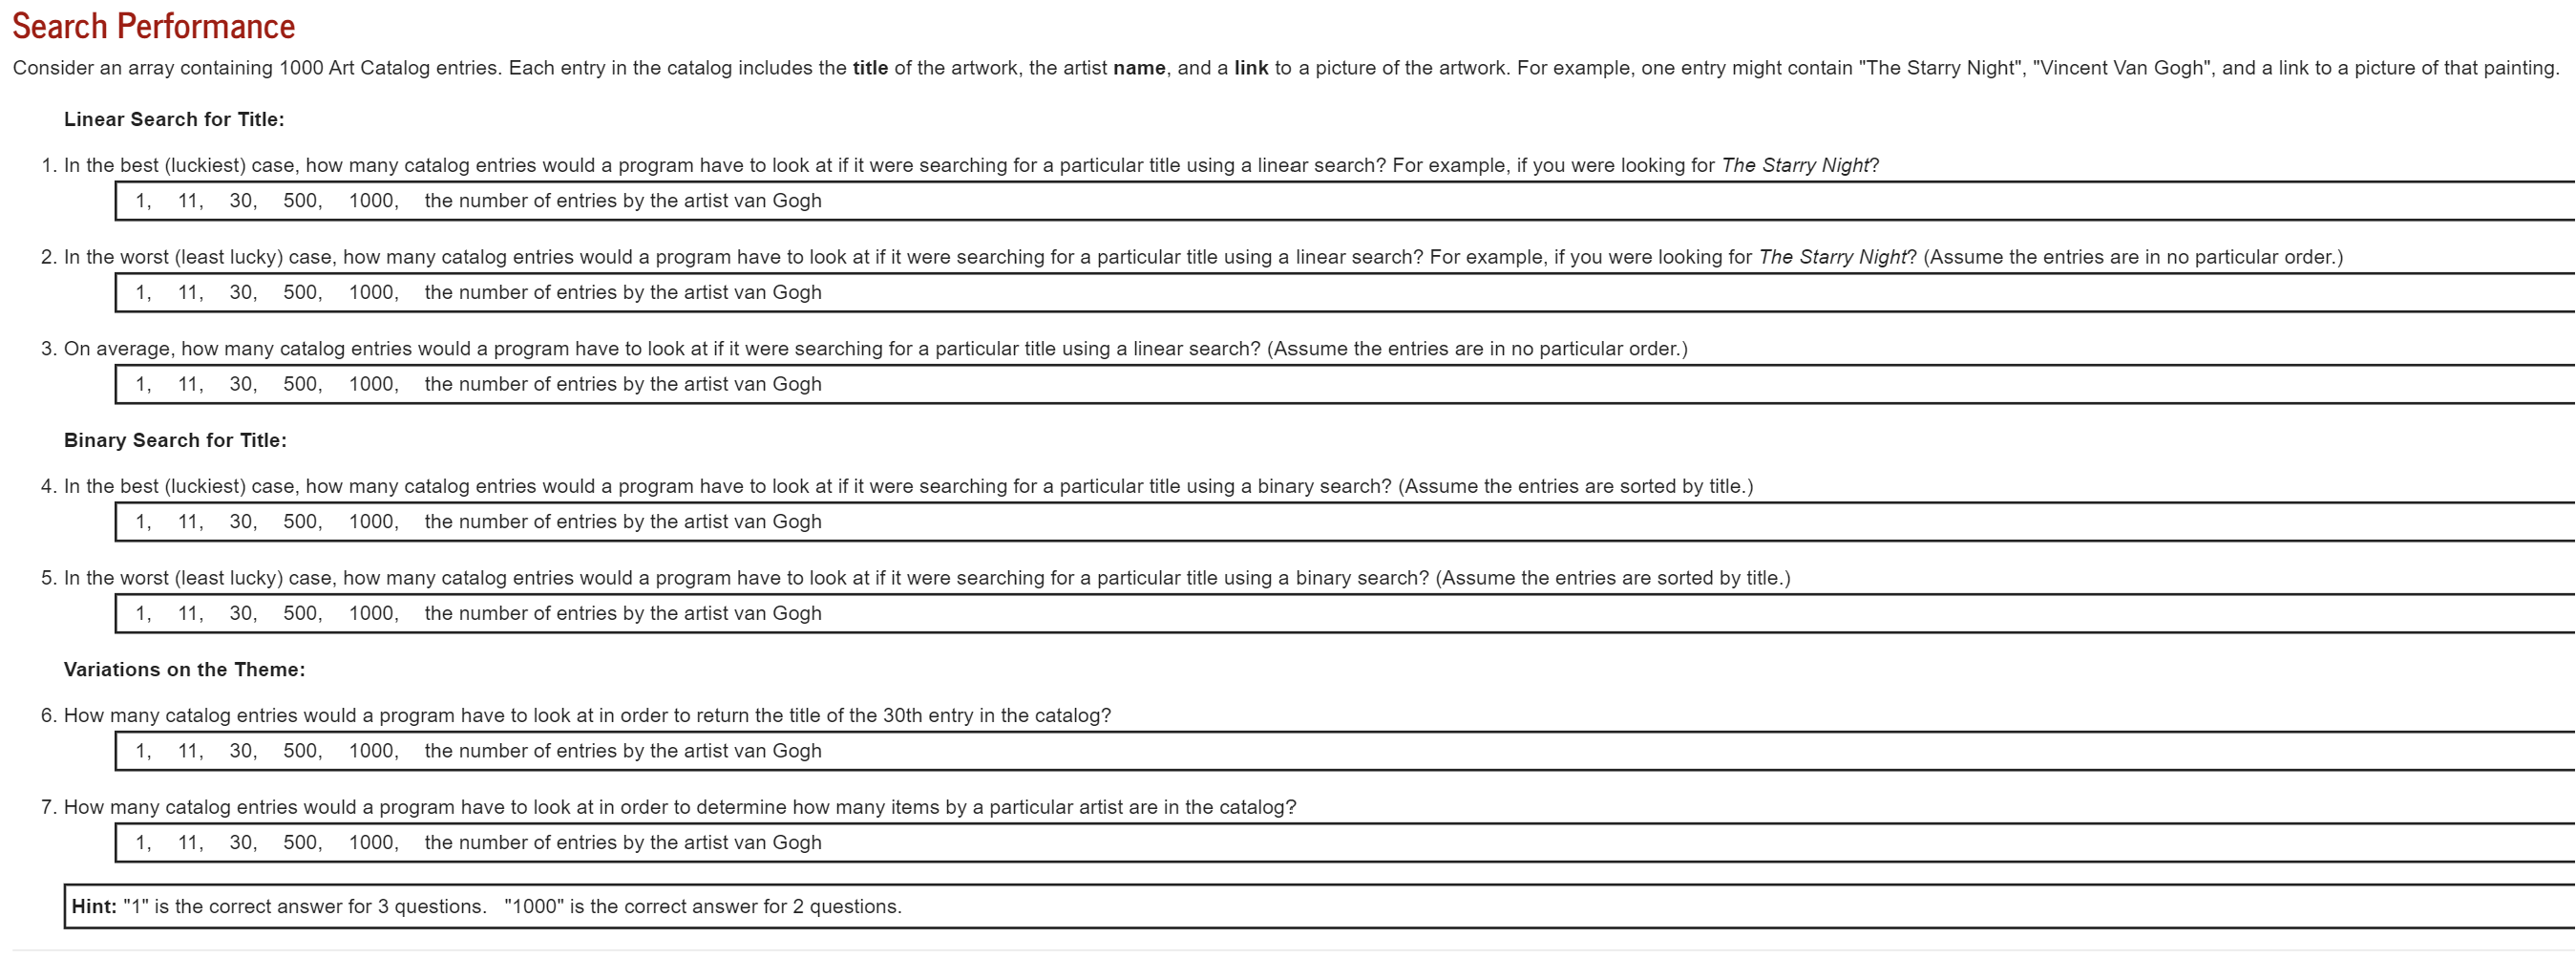
Search Performance Linear Search for Title: \( 1, \quad 11, \quad 30,500,1000, \quad \) the number of entries by the artist van Gogh \( 1,11,30,500,1000, \quad \) the number of entries by the artist van Gogh 3. On average, how many catalog entries would a program have to look at if it were searching for a particular title using a linear search? (Assume the entries are in no particular order.) \( 1,11,30,500,1000, \quad \) the number of entries by the artist van Gogh Binary Search for Title: \( 1,11,30,500,1000, \quad \) the number of entries by the artist van Gogh \( 1,11,30,500,1000, \quad \) the number of entries by the artist van Gogh Variations on the Theme: 6. How many catalog entries would a program have to look at in order to return the title of the 30th entry in the catalog? \( 1,11,30,500,1000, \quad \) the number of entries by the artist van Gogh 7. How many catalog entries would a program have to look at in order to determine how many items by a particular artist are in the catalog? \( 1,11,30,500,1000, \quad \) the number of entries by the artist van Gogh Hint: " 1 " is the correct answer for 3 questions. "1000" is the correct answer for 2 questions.

View Answer
divider
ANSWERED

Andrew Davis verified

Numerade educator

Use calculus to derive the cost-minimizing combination of capital and labor for a firm that has production process described by a Cobb-Douglas isoquant, q = 10 · L^.5 K^.5, where q = 100. Assume that the price of labor, w, is 10 and the price of capital, r, is 40. That is, find the exact number of units of L and K that will minimize the cost of producing 100 units of output in the long run. When you are done, please draw a diagram (isoquant, isocost line, cost-minimizing point) that illustrates the solution you just found.

View Answer
divider
INSTANT ANSWER

If a consumer's utility function takes the form \( U(B, C)=B+2 C^{\cdot 5} \), what is the consumer's demand function for good \( B \) ? a. \( \quad B=\left(\frac{2 p_{B}}{p_{C}}\right)^{2} \) b. \( B=\frac{Y}{p_{C}}-\frac{4 p_{B}}{p_{C}} \) c. \( B=\frac{0.5 Y}{p_{B}} \) d. \( B=\frac{Y}{p_{C}}-\frac{p_{B}}{p_{C}} \)

View Answer
divider
INSTANT ANSWER

If a consumer's utility function takes the form \( U(A, B)=A^{\cdot 7} B^{3} \), what is the consumer's demand function for good A IF her income is 100 and the price of good \( B \) is 3.55 ? a. \( \quad 19.72 \) b. \( A=\frac{70}{p_{A}} \) c. \( A=\frac{100}{p_{A}} \) d. \( A=\frac{30}{p_{A}} \)

View Answer
divider
INSTANT ANSWER

As is true for all of us, Lisa has many weekly expenses. What might be less common is the fact that Lisa likes to buy broccoli \( \left(q_{B}\right) \) and carrots \( \left(q_{C}\right) \) for all the money left after her required expenses. Lisa's utility function is standard Cobb-Douglas, \( U\left(q_{B}, q_{C}\right)=q_{B}^{0.3} q_{C}^{0.7} \). 1. Before we specify what Lisa's "disposable" income is and what the price of a head of broccoli and a small bag of carrots are, please derive expressions for the demand for broccoli and carrots (that is, derive demand for the two goods as functions of \( Y, p_{B} \), and \( \left.p_{C}\right) \). In other words, find the following demand functions: \( q_{B}=f\left(Y, p_{B}, p_{C}\right) \) and \( q_{c}=f\left(Y, p_{B}, p_{C}\right) \). Use the substitution method for one good and the short-cut for the other good. 2. Using the demand functions that you derived in question 1, please find Lisa's optimal consumption of broccoli and carrots (the quantity demanded, if you will) if \( Y=10 \), \( p_{B}=0.60 \), and \( p_{C}=1.00 \). 3. Draw the (inverse) demand curve for broccoli and indicate Lisa's consumption of broccoli. To do this you need to pick at least one other price of broccoli, I suggest choosing \( p_{B}=0.30 \). Next assume that Lisa's weekly required expenses are reduced so that she now is able to spend \( 20(Y=20) \) on broccoli and carrots. 4. In your previous demand diagram, please draw a new demand curve and describe what happened. That is, find the new demand curve for the two prices of broccoli, \( p_{B}=0.60 \) and \( p_{B}=0.30 \), but with a new income (budget) level. Use the short-cut for this question. 5. Finally, derive Lisa's Engel curve for broccoli. For this question, suppose that the price of broccoli is \( p_{B}=0.60 \). NOTE: The Engel curve shows a relationship between quantity demanded of a single good and income, holding prices constant. To draw the Engel curve, we plot income ( \( Y \) - on the vertical axis) against quantity demanded ( \( q_{B}- \) on the horizontal axis). 6. For fun (extra and if time permits): find the income elasticity of demand for broccoli at the initial consumption point (when \( Y=10 \) ). Also, is broccoli a normal good (or is it an inferior good, as some children claim)? HINT: Income elasticity of demand \( =\varepsilon_{Y}=\frac{\% \Delta \text { in } q_{B}}{\% \Delta \operatorname{in} Y}=\frac{d q_{B}}{d Y} \frac{Y}{q_{B}} \)

View Answer
divider
ANSWERED

Oluwadamilola Ameobi verified

Numerade educator

In Sweden there are 10 million people that are all equal and can be represented by a consumer named Patrik. Patrik has an income of 1,000 that he can spend on either food (F) or beer (B). Patrik's utility function (and hence every citizen's utility function) can be described as: U(F,B) = 0.001·F².B³ Currently, the price of food, pF, is 10 and the price of beer, pB, is 20. How many units of food will Patrik, our representative Swede, consume?

View Answer
divider
INSTANT ANSWER

Katrina buys apples and bananas. We have estimated that Katrina's utility function is standard Cobb-Douglas with the exponent on apples equal to 0.4 (see equation 3.1 in textbook if needed). We also know that Katrina has allocated 30 dollars on the consumption of apples and bananas. Currently the price of an apple is 2 dollars, and the price of a banana is 1 dollar. How many apples and bananas will Katrina choose to consume? Solve this problem on a piece of paper. Submit your answer by (1) scanning your solution paper carefully and (2) uploading your scanned pdf on Moodle. For full credit your solution should include the following parts: 1. A set-up of the constrained optimization problem. That is, write your problem as shown in, for example, equation 3.15 in the textbook. Write MAX before the function that you will maximize and write SUBJECT TO before your constraint. Do this every time I ask you to write down the consumer's constrained optimization problem. 2. A step-by-step solution using either the Lagrangian Method or the Substitution Method. 3. A brief written explanation of your results. 4. A DIAGRAM that shows Katrina's budget constraint and a representative indifference curve, as well as the optimal consumption bundle. Everything should be carefully and neatly written (easy to read). The diagram should be drawn using a ruler. Each of your steps should be separate from previous and following work. I suggest that you write (1) for step \( 1,(2) \) for step 2 , and so forth...

View Answer
divider
AWAITING AN EDUCATOR

Suppose a person has allocated a monthly budget of 200 and they like to consume coffee \( (C) \) and bagels \( (B) \). The price of a cup of coffee \( \left(p^{C}\right) \) is 2 , while the price of a bagel \( \left(p^{B}\right) \) is 1 . Their preferences for coffee and are shown by the following utility function: \( U(C, B)=(C)^{2} \cdot(B) \). A. Before you make your calculation, set up the constrained utility maximization problem. Also, write one sentence that gives the intuition behind your set-up. FYI: The words "set up" means writing the constrained optimization problem that you will solve (the objective function and the constraint). B. How many cups of coffee and how many bagels should the person purchase per month? [You can use either the substitution method or the Lagrangian method to solve this problem.] FYI: This utility function is not a Cobb-Douglas function. So, carefully apply the rules of differentiation as learned in Calculus (Math Review). C. Suppose there is a promotion so that the price of bagels falls to 0.50 . How many cups of coffee and how many bagels should the person then purchase per month? FYI: Rewrite your constraint and then solve the new problem. D. Given your answers to \( B \) and \( C \), can you draw a demand curve of bagels? If the answer is yes, then please draw the demand curve. FYI: To draw a demand curve we need to hold all factors that affect demand constant (such as income, preferences, and prices of related goods). Then we change the price of the particular good (like bagels) and see how the quantity demanded (of bagels) changes. Then we plot the two (price, quantity)combinations.

View Answer
divider
ANSWERED

Israel Hernandez verified

Numerade educator

Find the derivatives of the given functions: (a) ( y=arcsin (cos (x)) ) (b) ( y=operatorname{arcsec}left(x^{4} ight) ) (c) ( y=cos (arctan (sqrt{x})) )

View Answer
divider