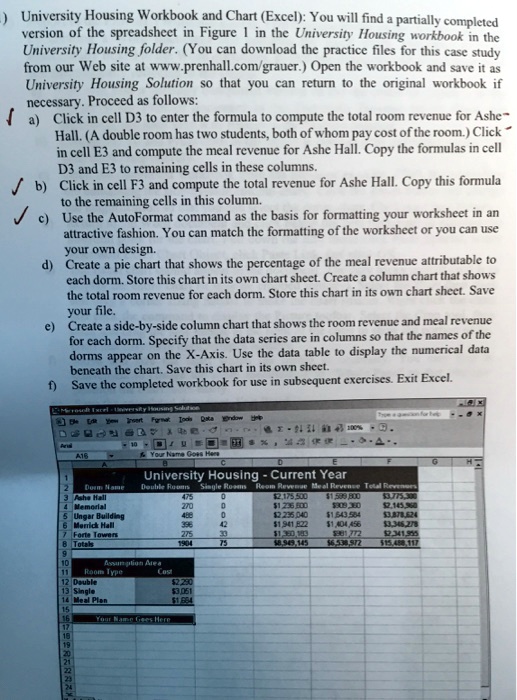
University Housing folder. (You can download the practice files for this case study from our website at www.prenhall.com/grauer.) Open the workbook and save it as University Housing Solution so that you can return to the original workbook if necessary. Proceed as follows:
a) Click in cell D3 to enter the formula to compute the total room revenue for Ashe Hall. (A double room has two students, both of whom pay the cost of the room.)
b) Click in cell E3 and compute the meal revenue for Ashe Hall. Copy the formulas in cell D3 and E3 to the remaining cells in these columns.
c) Click in cell F3 and compute the total revenue for Ashe Hall. Copy this formula to the remaining cells in this column.
d) Use the AutoFormat command as the basis for formatting your worksheet in an attractive fashion. You can match the formatting of the worksheet or you can use your own design.
e) Create a pie chart that shows the percentage of the meal revenue attributable to each dorm. Store this chart in its own chart sheet.
f) Create a column chart that shows the total room revenue for each dorm. Store this chart in its own chart sheet.
g) Save your file.
h) Create a side-by-side column chart that shows the room revenue and meal revenue for each dorm. Specify that the data series are in columns so that the names of the dorms appear on the X-Axis. Use the data table to display the numerical data beneath the chart. Save this chart in its own sheet.
i) Save the completed workbook for use in subsequent exercises.
j) Exit Excel.
-41%
University Housing - Current Year
0
$2,175,500 $1,236,800 $2,235,040 $1,941,220 $1,350,183
$1,599,800 $909,380 $1,543,584 $1,404,456 $81,772
$3,775,300 $2,145,360 $3,878,624 $3,346,278 $2,341,955 15,488,117
norial
Ungar Building Morrick Hall rte Towen
Double Single
8222