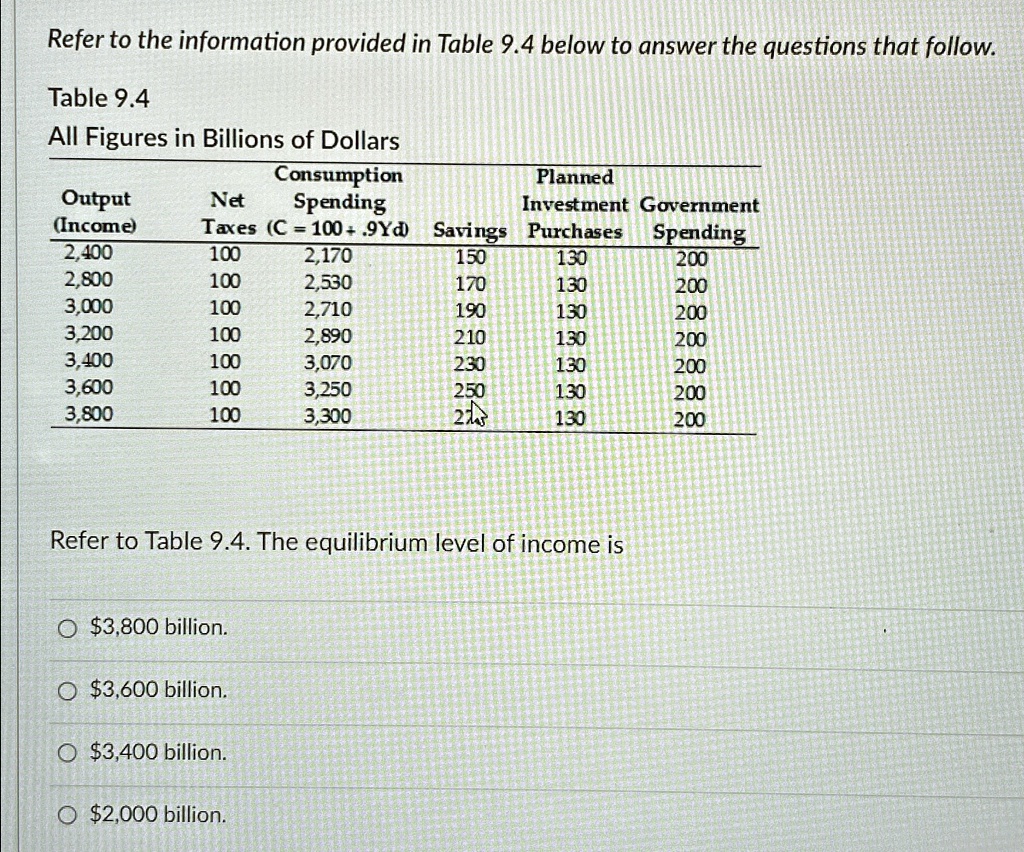
Refer to the information provided in Table 9.4 below to answer the questions that follow.
Table 9.4
All Figures in Billions of Dollars
| Output | Income | Consumption Planned | Government Spending |
|--------|--------|----------------------|----------------------|
| Net Spending | Investment | Taxes (C=100+.9Yd) | Savings Purchases |
| 2,400 | 100 | 2,170 | 150 | 130 | 200 |
| 2,800 | 100 | 2,530 | 170 | 130 | 200 |
| 3,000 | 100 | 2,710 | 190 | 130 | 200 |
| 3,200 | 100 | 2,890 | 210 | 130 | 200 |
| 3,400 | 100 | 3,070 | 230 | 130 | 200 |
| 3,600 | 100 | 3,250 | 250 | 130 | 200 |
| 3,800 | 100 | 3,300 | 245 | 130 | 200 |
Refer to Table 9.4. The equilibrium level of income is
$3,800 billion.
$3,600 billion.
$3,400 billion.
$2,000 billion.
Refer to the information provided in Table 9.4 below to answer the questions that follow.
Table 9.4 All Figures in Billions of Dollars
Consumption Planned Net Spending Investment Government (Income) Taxes(C=100+.9Y Savings Purchases Spending
2,400 100 2,170 150 130 200
2,800 100 2,530 170 130 200
3,000 100 2,710 190 130 200
3,200 100 2,890 210 130 200
3,400 100 3,070 230 130 200
3,600 100 3,250 250 130 200
3,800 100 3,300 245 130 200
Refer to Table 9.4. The equilibrium level of income is
$3,800 billion
$3,600 billion.
$3,400 billion.
$2,000 billion