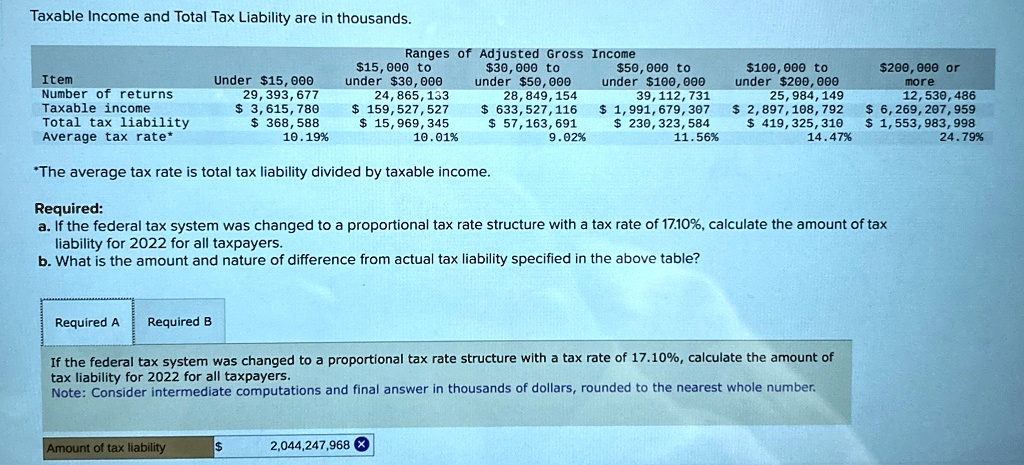
Taxable Income and Total Tax Liability are in thousands.
Item
Number of returns
Taxable income
Total tax liability
Average tax rate*
Under $15,000
29,393,677
$ 3,615,780
$ 368,588
10.19%
Ranges of Adjusted Gross Income
$15,000 to
under $30,000
24,865,133
$159,527,527
$15,969,345
10.01%
$30,000 to
under $50,000
28,849,154
$ 633,527,116
$57,163,691
9.02%
$50,000 to
under $100,000
39,112, 731
$ 1,991,679,307
$230,323,584
11.56%
$100,000 to
under $200,000
25,984, 149
$ 2,897,108, 792
$ 419,325, 310
14.47%
$200,000 or
more
12,530,486
$ 6,269,207,959
$1,553,983,998
24.79%
*The average tax rate is total tax liability divided by taxable income.
Required:
a. If the federal tax system was changed to a proportional tax rate structure with a tax rate of 17.10%, calculate the amount of tax
liability for 2022 for all taxpayers.
b. What is the amount and nature of difference from actual tax liability specified in the above table?
If the federal tax system was changed to a proportional tax rate structure with a tax rate of 17.10%, calculate the amount of
tax liability for 2022 for all taxpayers.
Note: Consider intermediate computations and final answer in thousands of dollars, rounded to the nearest whole number.
Amount of tax liability
$ 2,044,247,968