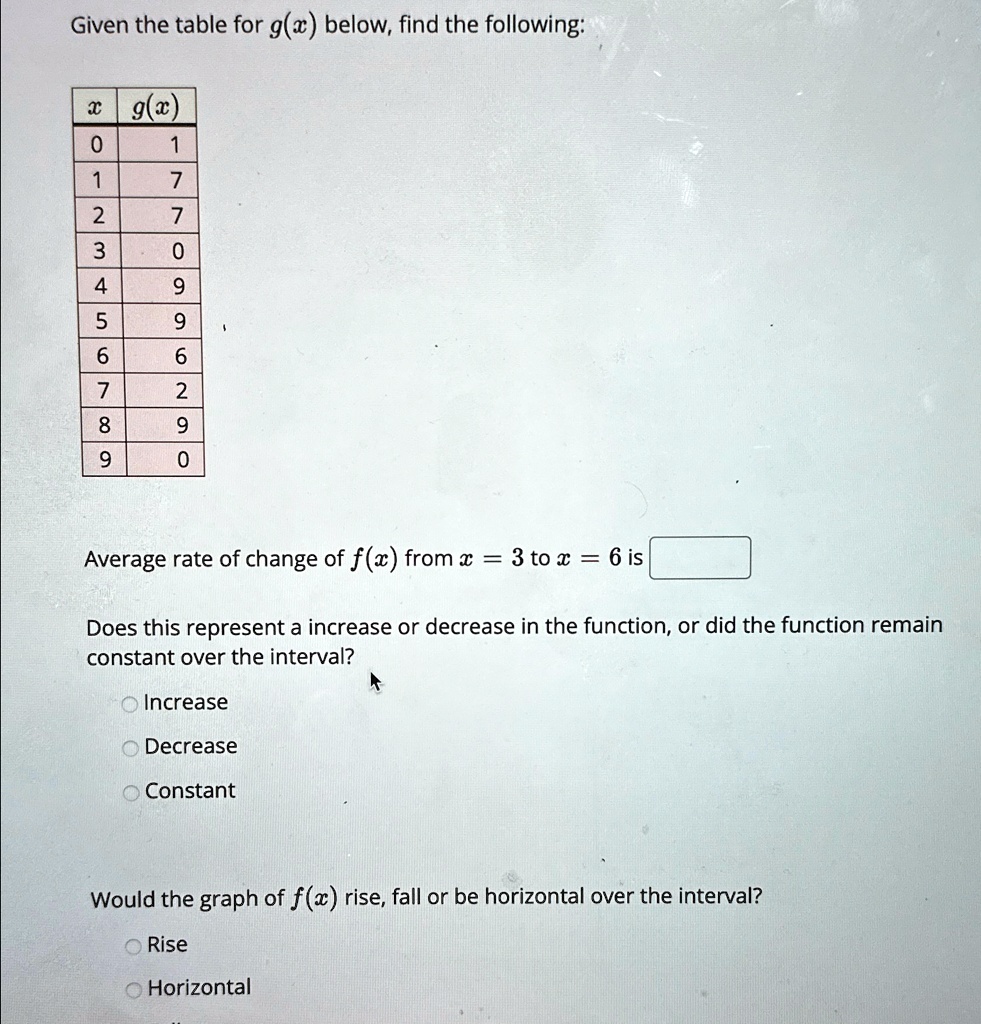
Given the table for g(x) below, find the following:
x g(x)
0 1
1 7
2 7
3 0
4 9
5 9
6 6
7 2
8 9
9 0
Average rate of change of f(x) from x = 3 to x = 6 is
Does this represent a increase or decrease in the function, or did the function remain
constant over the interval?
Increase
Decrease
Constant
Would the graph of f(x) rise, fall or be horizontal over the interval?
Rise
Horizontal