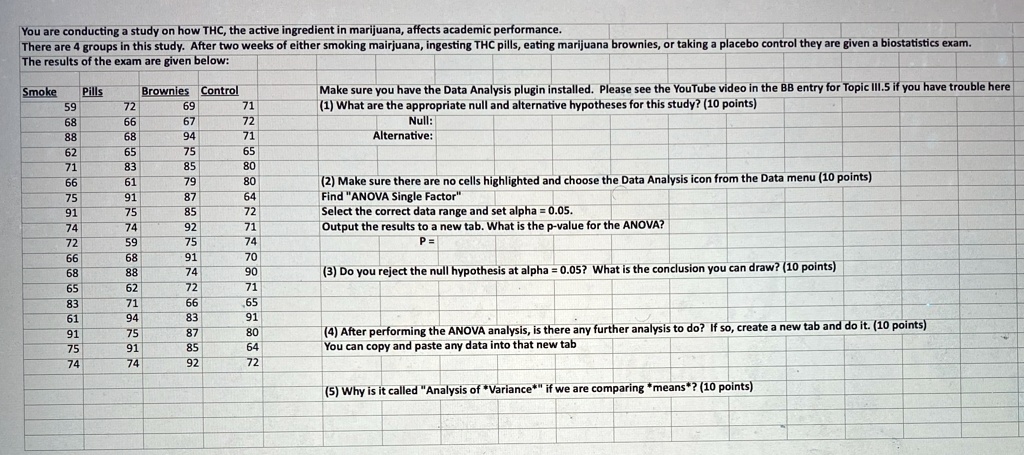
You are conducting a study on how THC, the active ingredient in marijuana, affects academic performance.
There are 4 groups in this study. After two weeks of either smoking mairjuana, ingesting THC pills, eating marijuana brownies, or taking a placebo control they are given a biostatistics exam.
The results of the exam are given below:
Smoke Pills Brownies Control
59 72 69 71
68 66 67 72
88 68 94 71
62 65 75 65
71 83 85 80
66 61 79 80
75 91 87 64
91 75 85 72
74 74 92 71
72 59 75 74
66 68 91 70
68 88 74 90
65 62 72 71
83 71 66 65
61 94 83 91
91 75 87 80
75 91 85 64
74 74 92 72
Make sure you have the Data Analysis plugin installed. Please see the YouTube video in the BB entry for Topic III.5 if you have trouble here
(1) What are the appropriate null and alternative hypotheses for this study? (10 points)
Null:
Alternative:
(2) Make sure there are no cells highlighted and choose the Data Analysis icon from the Data menu (10 points)
Find "ANOVA Single Factor"
Select the correct data range and set alpha = 0.05.
Output the results to a new tab. What is the p-value for the ANOVA?
P =
(3) Do you reject the null hypothesis at alpha = 0.05? What is the conclusion you can draw? (10 points)
(4) After performing the ANOVA analysis, is there any further analysis to do? If so, create a new tab and do it. (10 points)
You can copy and paste any data into that new tab
(5) Why is it called "Analysis of *Variance*" if we are comparing *means*? (10 points)