Questions asked
A vertical line drawn through a normal distribution at $z = -1.00$ separates the distribution into two sections, the body and the tail. What proportion of the distribution is in the body? 0.8413 0.1587 0.3413 -0.1587
Which of the following is not necessary for DNA replication in bacteria? O helicase O DNA polymerase O ligase O telomerase O all of the above are necessary for DNA replication
In your post, based on your logic model, suggest one formative (or process) evaluation idea and one summative (outcome) evaluation idea. Ideas for your plans should be participatory (that is, inclusive of stakeholders).
5. On a particle level, show the reaction of hydrogen and oxygen to make water. Show what chemical bonds are breaking and what chemical bonds are forming. Use this to explain: a. The Law of Conservation of Mass b. Why we can define a chemical reaction as the breaking and/or forming of chemical bonds.
If an organism shows a recessive phenotype such as a short pea plant the genotype can be
Which of the following are examples of non-medication alternatives with which to treat behaviors of distress? A kind word Getting something to eat Engaging in an activity All of the above
State the dimension of the matrix.\begin{bmatrix} 5 & -6 \\ 2 & -7 \\ -4 & -3 \end{bmatrix}
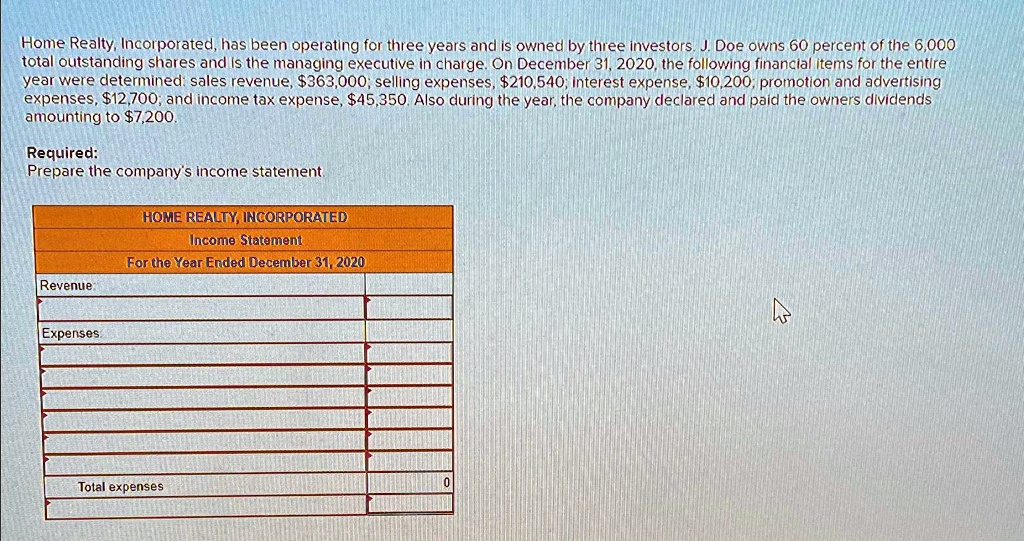
Sales revenue: $363,000 Selling expenses: $210,540 Interest expense: $10,200 Promotion and advertising expenses: $12,700 Income tax expense: $45,350 Total expenses: $278,790 Net income: $84,210
Multiple Choice Questions Identify the choice that best completes the statement or answers the question. 1. The domain of the graph of $y = \sin x$ is a. $0 \le x \le 2\pi$ b. $-1 \le x \le 1$ c. $-2\pi \le x \le 2\pi$ d. $x \in \mathbb{R}$ 2. The range of the graph of $y = \cos x$ is a. $0 \le y \le 2\pi$ b. $-1 \le y \le 1$ c. $-2\pi \le x \le 2\pi$ d. $y \in \mathbb{R}$ 3. The graph of $y = \cos x$ can be obtained by translating the graph of $y = \sin x$ a. $\frac{\pi}{2}$ rad to the right b. $\frac{\pi}{4}$ rad to the right c. $\frac{\pi}{2}$ rad to the left d. $\frac{\pi}{4}$ rad to the left
B. During the energy crisis of the mid-1970s a proposal was made to increase the tax on gasoline by 50c per gallon. The government would give poor consumers an amount of cash large enough that they could buy their original bundle (of gasoline and other goods). 1. Show how a typical poor person's budget line changes as a result of the tax and the subsidy. 2. Use a graph to show how the tax and subsidy could affect this person's optimal bundle. 3. Is this individual better or worse off or stay on the same bundle as a result of the tax and the subsidy? Explain your answer using your graph and show the possible scenarios.