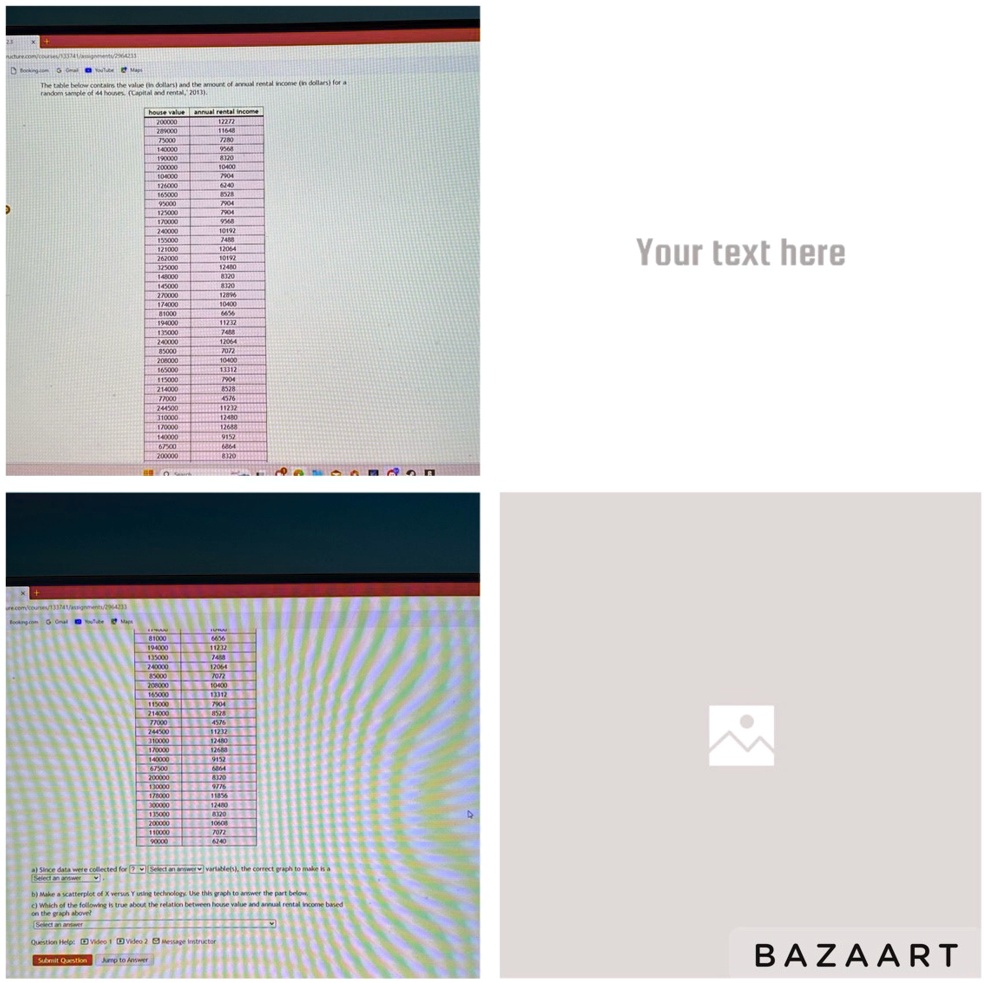
(A) Data was collected for either 1, 2, 3, 6, or 44. Is it a quantitative variable or a qualitative variable? The correct graph is a bar chart, histogram, side-by-side bar chart, or scatterplot.
For (c), it gives us 3 options. Please pick one:
1. There does not appear to be a relation between house value and annual rental income.
2. As we increase the value of house value, annual rental income tends to decrease.
3. As we increase the value of house value, annual income tends to increase.