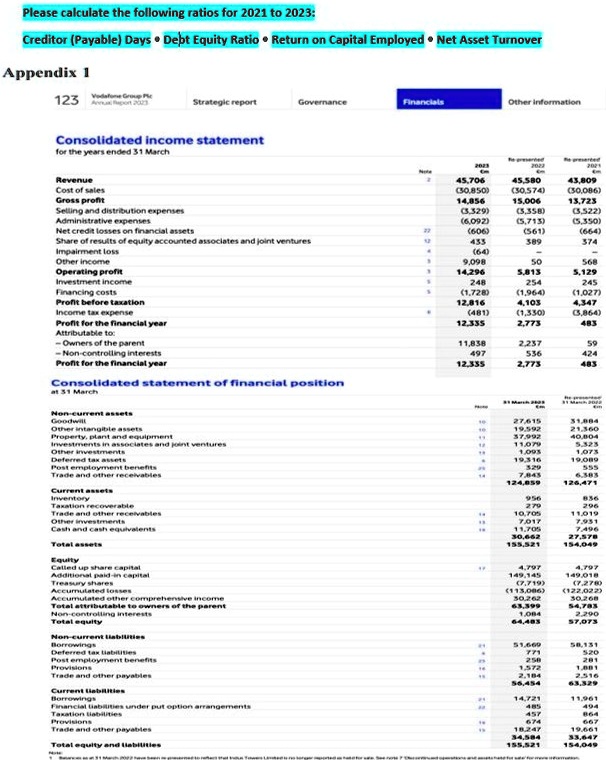
Please calculate the following ratios for 2021 to 2023:
Creditor (Payable) Days • Debt Equity Ratio • Return on Capital Employed • Net Asset Turnover
Please calculate the following ratios for 2021 to 2023:
Creditor (Payable) Days • Debt Equity Ratio • Return on Capital Employed • Net Asset Turnover
Appendix 1
Strategic report
Consolidated income statement for the years ended 31 March
Revenue Cost of sales Gross profit
2021: 43,809 (50,086) 13,723
2022: 45,706 (30,850) 14,856
2023: 45,580 (30,574) 15,006
Administrative expenses Net credit losses on financial assets Share of results of equity accounted associates and joint ventures Impairment loss Other income Operating profit Investment income Financing costs Profit before taxation Income tax expense Profit for the financial year Attributable to - Owners of the parent - Non-controlling interests Profit for the financial year
2021: 5,813 254 (1,964) 4,103 (1,330) 2,773
2022: 5,129 245 (1,027) 4,347 3,864 483
2023: 11,838 497 12,335
Consolidated statement of financial position at 31 March
Goodwill
2021: 27,615
2022: 31,084
2023: 27,615
Property, plant and equipment investments in associates and joint ventures Other investments Deferred tax assets Post-employment benefits
Current assets inventory
2021: 956 279 10,705 7,017 11,705 30,662
2022: 1,073 19,089 6,383 126,471
2023: 7,931 7,496 154,049
Trade and other receivables
Equity Called up share capital Additional paid-in capital Treasury shares Accumulated losses Accumulated other comprehensive income Total attributable to owners of the parent Non-controlling interests Total equity
2021: 4,797 149,145 (7,719) (113,006) 30,262 63,399 1,084 64,483
2022: 4,797 149,018 7,278 (122,022) 30,268 54,703 2,290 57,073
Non-current Borrowings Deferred tax liabilities
2021: 51,669 771 256 1,572 2,184 56,452
2022: 50,131 520 261 1,001 63,329 11,961
Provisions
Financial liabilities
Provisions Trade and other
2021: 19,661 33,647 154,049
2022: 18,247 34,584 155,521
Total