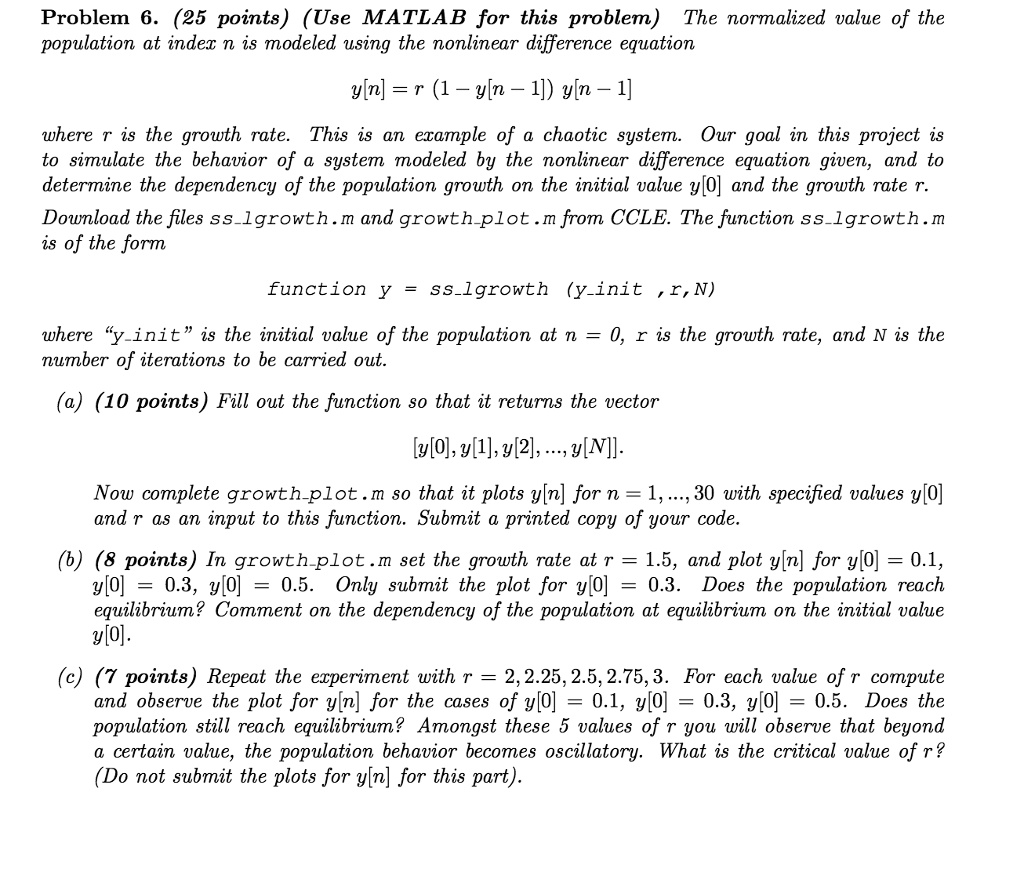
Problem 6. (25 points) (Use MATLAB for this problem) The normalized value of the population at index n is modeled using the nonlinear difference equation:
y[n] = r(1 - y[n-1]) * y[n-1]
where r is the growth rate. This is an example of a chaotic system. Our goal in this project is to determine the dependency of the population growth on the initial value y[0] and the growth rate r.
Download the files ss_lgrowth.m and growth_plot.m from CCLE. The function ss_lgrowth.m is of the form:
function y = ss_lgrowth(y_init, r, N)
where "y_init" is the initial value of the population at n = 0, r is the growth rate, and N is the number of iterations to be carried out.
(a) (10 points) Fill out the function so that it returns the vector [y[0], y[1], y[2], ..., y[N]]. Now complete growth_plot.m so that it plots y[n] for n = 1, ...., 30 with specified values y[0] and r as an input to this function. Submit a printed copy of your code.
(b) (8 points) In growth_plot.m, set the growth rate at r = 1.5 and plot y[n] for y[0] = 0.1, y[0] = 0.3, and y[0] = 0.5. Only submit the plot for y[0] = 0.3. Does the population reach equilibrium? Comment on the dependency of the population at equilibrium on the initial value y[0].
(c) (7 points) Repeat the experiment with r = 2, 2.25, 2.5, 2.75, and 3. For each value of r, compute and observe the plot for y[n] for the cases of y[0] = 0.1, y[0] = 0.3, and y[0] = 0.5. Does the population still reach equilibrium? Amongst these 5 values of r, you will observe that beyond a certain value, the population behavior becomes oscillatory. What is the critical value of r? (Do not submit the plots for y[n] for this part).