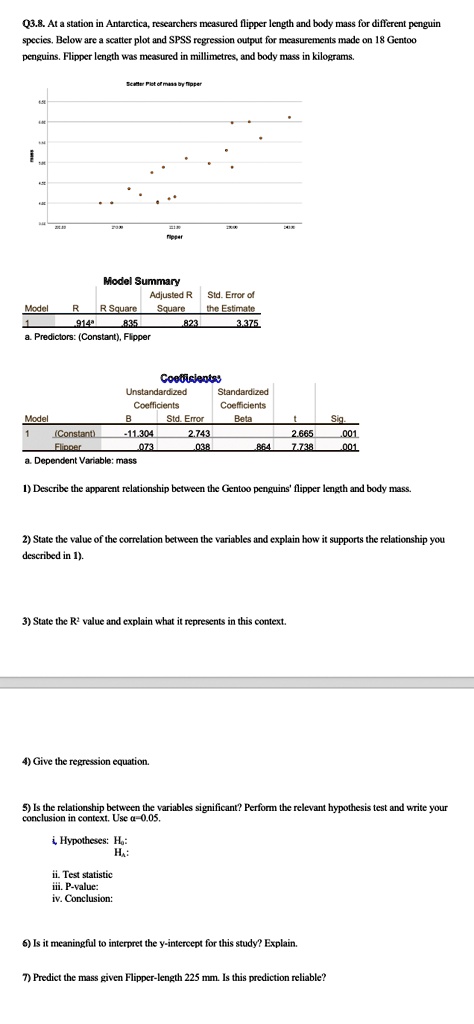
Q3.8. At a station in Antarctica, researchers measured flipper length and body mass for different penguin species. Below are a scatter plot and SPSS regression output for measurements made on 18 Gentoo penguins. Flipper length was measured in millimeters, and body mass in kilograms.
Model Summary Adjusted R Std. Error of Model R R Square Square the Estimate 1 914a 835 823 3.375 a. Predictors: (Constant), Flipper
Coefficientas Unstandardized Standardized Coefficients Coefficients Model B Std.Error Beta 1 (Constant) -11,304 2.743 Flipper 0.73 0.38 0.864 a. Dependent Variable: mass
Sia 2.665 7.738 0.001, 0.001
I) Describe the apparent relationship between the Gentoo penguins' flipper length and body mass.
2) State the value of the correlation between the variables and explain how it supports the relationship you described in 1).
3) State the R value and explain what it represents in this context.
4) Give the regression equation.
5) Is the relationship between the variables significant? Perform the relevant hypothesis test and write your conclusion in context. Use α = 0.05.
i) Hypotheses: H0: β = 0, HA: β ≠0.
ii) Test statistic.
iii) P-value.
iv) Conclusion.
6) Is it meaningful to interpret the y-intercept for this study? Explain.
7) Predict the mass given Flipper-length 225 mm. Is this prediction reliable?