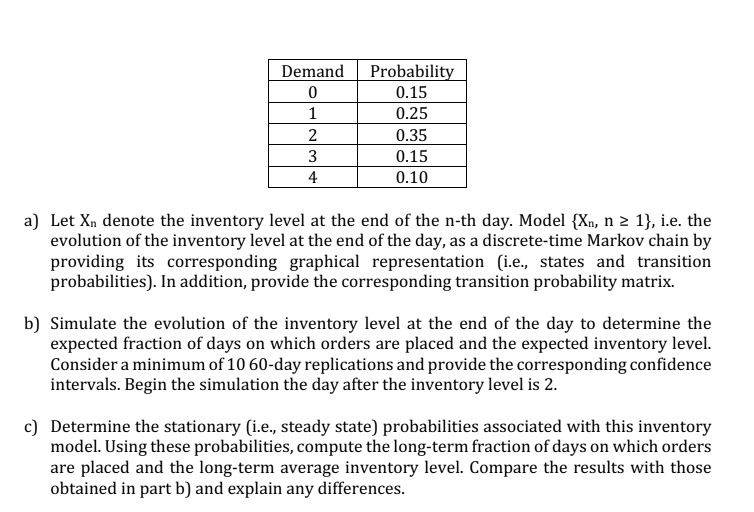
Demand Probability
0
0.15
1
0.25
2
0.35
3
0.15
4
0.10
a) Let $X_n$ denote the inventory level at the end of the n-th day. Model \{$X_n, n \ge 1\}, i.e. the
evolution of the inventory level at the end of the day, as a discrete-time Markov chain by
providing its corresponding graphical representation (i.e., states and transition
probabilities). In addition, provide the corresponding transition probability matrix.
b) Simulate the evolution of the inventory level at the end of the day to determine the
expected fraction of days on which orders are placed and the expected inventory level.
Consider a minimum of 10 60-day replications and provide the corresponding confidence
intervals. Begin the simulation the day after the inventory level is 2.
c) Determine the stationary (i.e., steady state) probabilities associated with this inventory
model. Using these probabilities, compute the long-term fraction of days on which orders
are placed and the long-term average inventory level. Compare the results with those
obtained in part b) and explain any differences.