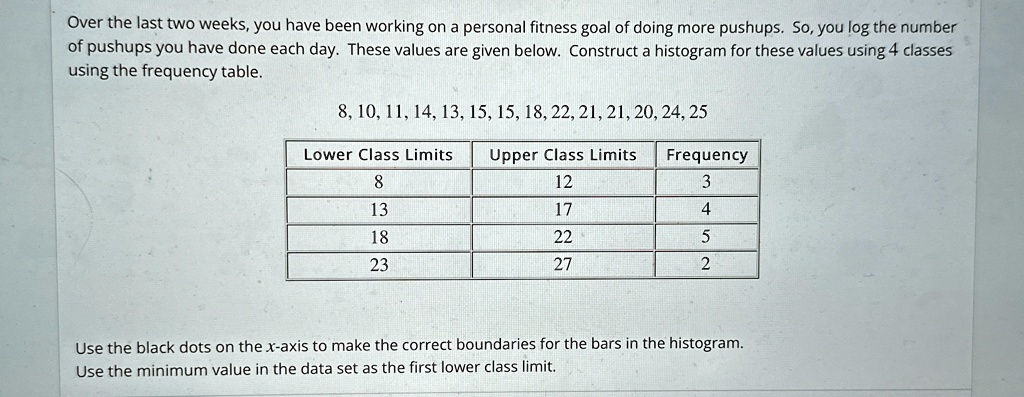
Over the last two weeks, you have been working on a personal fitness goal of doing more pushups. So, you log the number of pushups you have done each day. These values are given below. Construct a histogram for these values using 4 classes using the frequency table.
8, 10, 11, 14, 13, 15, 15, 18, 22, 21, 21, 20, 24, 25
Lower Class Limits Upper Class Limits Frequency
8 12 3
13 17 4
18 22 5
23 27 2
Use the black dots on the x-axis to make the correct boundaries for the bars in the histogram.
Use the minimum value in the data set as the first lower class limit.