\begin{tabular}{|l|c|c|c|c|c|}
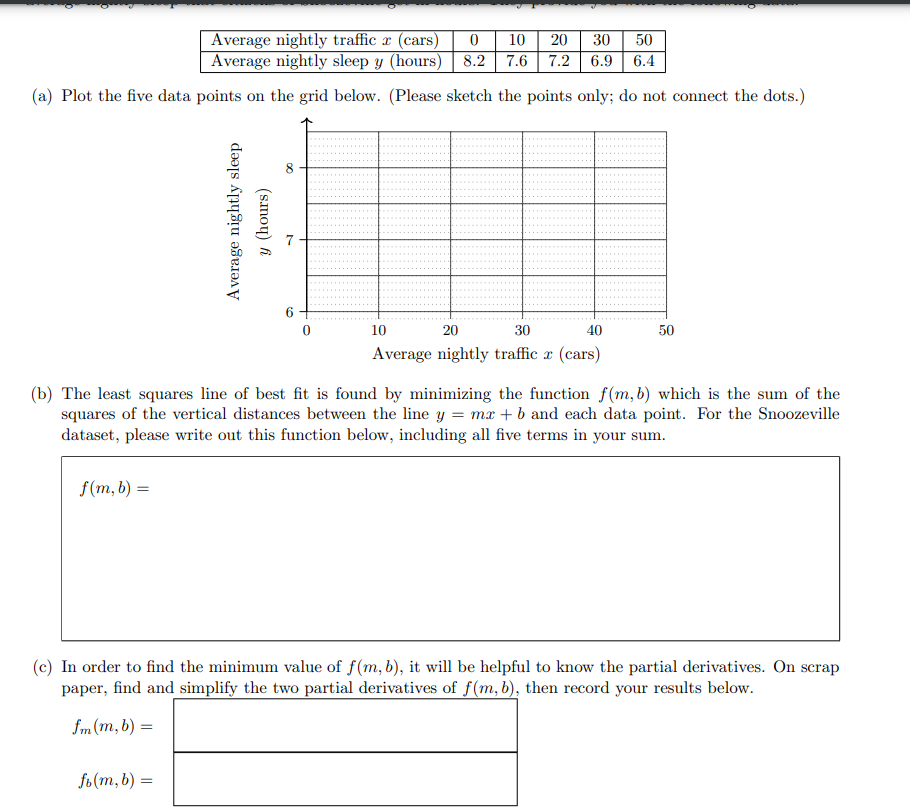
\hline Average nightly traffic \( x \) (cars) & 0 & 10 & 20 & 30 & 50 \\
\hline Average nightly sleep \( y \) (hours) & 8.2 & 7.6 & 7.2 & 6.9 & 6.4 \\
\hline
\end{tabular}
(a) Plot the five data points on the grid below. (Please sketch the points only; do not connect the dots.)
(b) The least squares line of best fit is found by minimizing the function \( f(m, b) \) which is the sum of the squares of the vertical distances between the line \( y=m x+b \) and each data point. For the Snoozeville dataset, please write out this function below, including all five terms in your sum.
\[
f(m, b)=
\]
(c) In order to find the minimum value of \( f(m, b) \), it will be helpful to know the partial derivatives. On scrap paper, find and simplify the two partial derivatives of \( f(m, b) \), then record your results below.
\[
\begin{array}{c}
f_{m}(m, b)= \\
f_{b}(m, b)=
\end{array}
\]