Given:
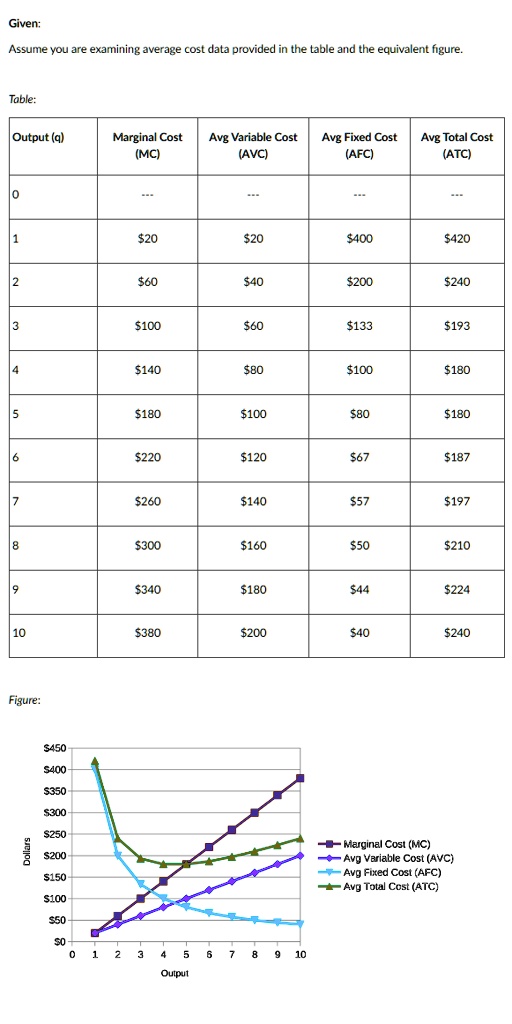
Assume you are examining average cost data provided in the table and the equivalent figure.
Question:
What is the relationship between output and average fixed cost?
Group of answer choices
Average fixed cost always declines as output rises.
Average fixed cost rises for low levels of output but declines for high levels of output.
Average fixed cost always rises as output rises.
Average fixed cost rises for high levels of output but declines for low levels of output.
---
Question:
What is the relationship between marginal cost and average total cost? [Select all that apply]
Group of answer choices
Average total cost always rises regardless of marginal cost.
For output levels where marginal cost is less than average total cost, then average total cost is declining.
There is an output level where marginal cost and average total cost are equal, this is the minimum value of average total cost.
Average total cost always declines regardless of marginal cost.
For output levels where marginal cost is greater than average total cost, then average total cost is rising.
Question:
When output is 2 units, what is total cost?
Group of answer choices
$480
$1,380
$900
$720
$1,680
$1,620
$80
$1,280
$400
$2,020
---
Question:
When output is 2 units, what is variable cost?
Group of answer choices
$720
$2,020
$480
$1,280
$900
$400
$1,620
$1,380
$80
$1,680
Question:
When output is 2 units, what is fixed cost?
Group of answer choices
$480
$1,680
$720
$1,280
$400
$1,380
$2,020
$80
$1,620
$900
---
Question:
When output is 8 units, what is total cost?
Group of answer choices
$1,680
$1,280
$400
$1,620
$720
$900
$80
$480
$2,020
$1,380
---
Question:
When output is 8 units, what is variable cost?
Group of answer choices
$900
$2,020
$1,380
$1,280
$80
$720
$1,680
$400
$1,620
$480
---
Question:
When output is 8 units, what is fixed cost?
Group of answer choices
$900
$480
$400
$1,280
$80
$2,020
$1,380
$1,620
$1,680
$720
Question:
What output level corresponds to minimum average total cost?
Group of answer choices
5
8
3
2
7
6
Given:
Assume you are examining average cost data provided in the table and the equivalent figure
Table:
Output (q)
Marginal Cost (MC)
Avg Variable Cost (AVC)
Avg Fixed Cost (AFC)
Avg Total Cost (ATC)
0
--
-.-
---
-.-
1
$20
$20
$400
$420
2
$60
$40
$200
$240
3
$100
$60
$133
$193
4
$140
$80
$100
$180
5
$180
$100
$80
$180
6
$220
$120
$67
$187
7
$260
$140
$57
$197
8
$300
$160
$50
$210
$340
$180
$44
$224
10
$380
$200
$40
$240
Figure:
$450
$350
$300
$250 $200 $150 $100 $50
Marginal Cost (MC) Avg Variable Cost (AVC) Avg Fixed Cost (AFC) Avg Total Cost (ATC)
0
1
2
3
5
7
8
6
10