Exercise 6-11 a-c
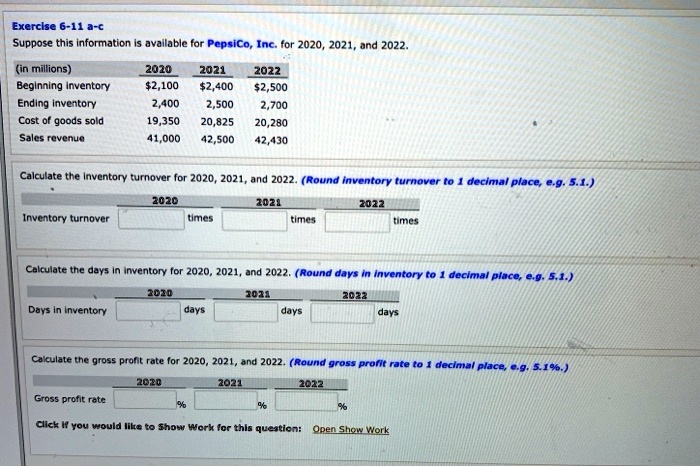
Suppose this information is available for PepsiCo, Inc. for 2020, 2021, and 2022.
2021
2022
$2,100 $2,400 $2,500
(in millions)
2020
Beginning inventory
Ending inventory
2,400
2,500 2,700
Cost of goods sold
19,350 20,825 20,280
Sales revenue
41,000 42,500 42,430
Calculate the inventory turnover for 2020, 2021, and 2022. (Round inventory turnover to 1 decimal place, e.g. 5.1.)
Inventory turnover
2020
times
2021
times
2022
times
Calculate the days in inventory for 2020, 2021, and 2022. (Round days in inventory to 1 decimal place, e.g. 5.1.)
Days in inventory
2020
days
2021
days
2022
days
Calculate the gross profit rate for 2020, 2021, and 2022. (Round gross profit rate to 1 decimal place, e.g. 5.1%).
2020
Gross profit rate
%
2021
2022
%
%
Click if you would like to Show Work for this question: Open Show Work