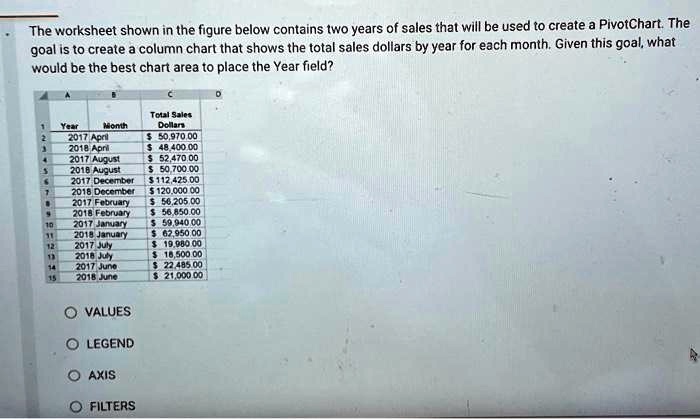
The worksheet shown in the figure below contains two years of sales that will be used to create a PivotChart. The
goal is to create a column chart that shows the total sales dollars by year for each month. Given this goal, what
would be the best chart area to place the Year field?
2
Year
Month
Total Sales
Dollars
$ 50,970.00
2017 April
2018 April
$ 48,400.00
2017 August
$ 52,470.00
2018 August
$ 50,700.00
2017 December
$112,425.00
2018 December
$120,000.00
2017 February
$ 56,205.00
2018 February
$ 56,850.00
2017 January
$ 59,940.00
2018 January
$ 62,950.00
2017 July
$ 19,980.00
2018 July
$ 18,500.00
2017 June
$ 22,485.00
2018 June
$ 21,000.00
VALUES
LEGEND
AXIS
FILTERS