Title
Apply the test based on to the data of Table 4.3.
Compare your results with those of Problem 1....
Description
Apply the test based on widehat(U) to the data of Table 4.3. Compare your results with those of Problem 1.
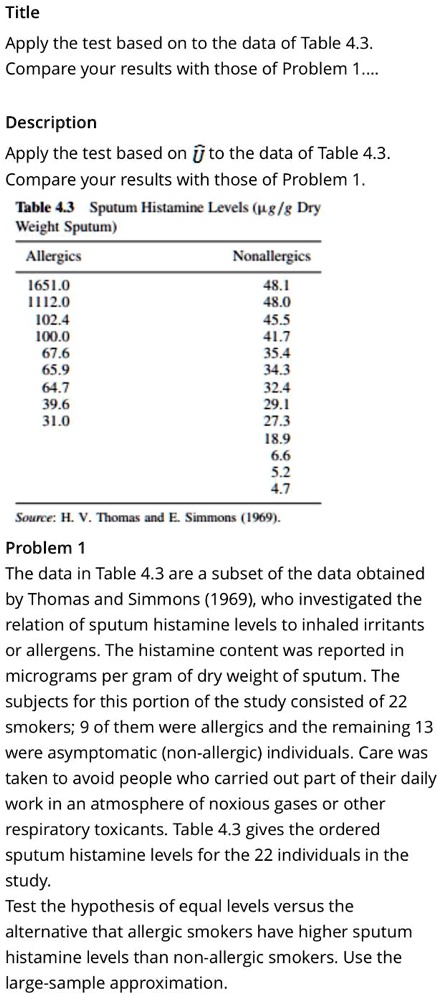
Table 4.3 Sputum Histamine Levels Dry Weight Sputum)
able[[Allergics,Nonallergics],[1651.0,48.1],[1112.0,48.0],[102.4,45.5],[100.0,41.7],[67.6,35.4],[65.9,34.3],[64.7,32.4],[39.6,29.1],[31.0,27.3],[,18.9],[,6.6],[,5.2]]
Source: H. V. Thomas and E. Simmons (1969).
Problem 1
The data in Table 4.3 are a subset of the data obtained by Thomas and Simmons (1969), who investigated the relation of sputum histamine levels to inhaled irritants or allergens. The histamine content was reported in micrograms per gram of dry weight of sputum. The subjects for this portion of the study consisted of 22 smokers; 9 of them were allergics and the remaining 13 were asymptomatic (non-allergic) individuals. Care was taken to avoid people who carried out part of their daily work in an atmosphere of noxious gases or other respiratory toxicants. Table 4.3 gives the ordered sputum histamine levels for the 22 individuals in the study.
Test the hypothesis of equal levels versus the alternative that allergic smokers have higher sputum histamine levels than non-allergic smokers. Use the large-sample approximation.
Title
Apply the test based on to the data of Table 4.3 Compare your results with those of Problem 1...
Description
Apply the test based on to the data of Table4.3 Compare your results with those of Problem 1. Table 4.3Sputum Histamine Levels (g/g Dry Weight Sputum)
Allergies
Nonallergics
1651.0 1112.0 102.4 100.0 67.6 65.9 64.7 39.6 31.0
48.1 48.0 45.5 41.7 35.4 34.3 32.4 29.1 27.3 18.9 6.6 5.2 4.7
Source:H.V.Thomas and E.Simmons (1969
Problem 1 The data in Table 4.3 are a subset of the data obtained
by Thomas and Simmons (1969),who investigated the relation of sputum histamine levels to inhaled irritants
or allergens.The histamine content was reported in
micrograms per gram of dry weight of sputum.The
subjects for this portion of the study consisted of 22
smokers;9of them were allergics and the remaining 13 were asvmptomatic(non-allergic)individuals.Care was
taken to avoidpeople who carried out part of their daily
work in an atmosphere of noxious gases or other respiratory toxicants.Table 4.3 gives the ordered sputum histamine levels for the 22 individuals in the study. Test the hypothesis of egual levels versus the alternative that allergic smokers have higher sputum histamine levels than non-allergic smokers. Use the large-sample approximation.