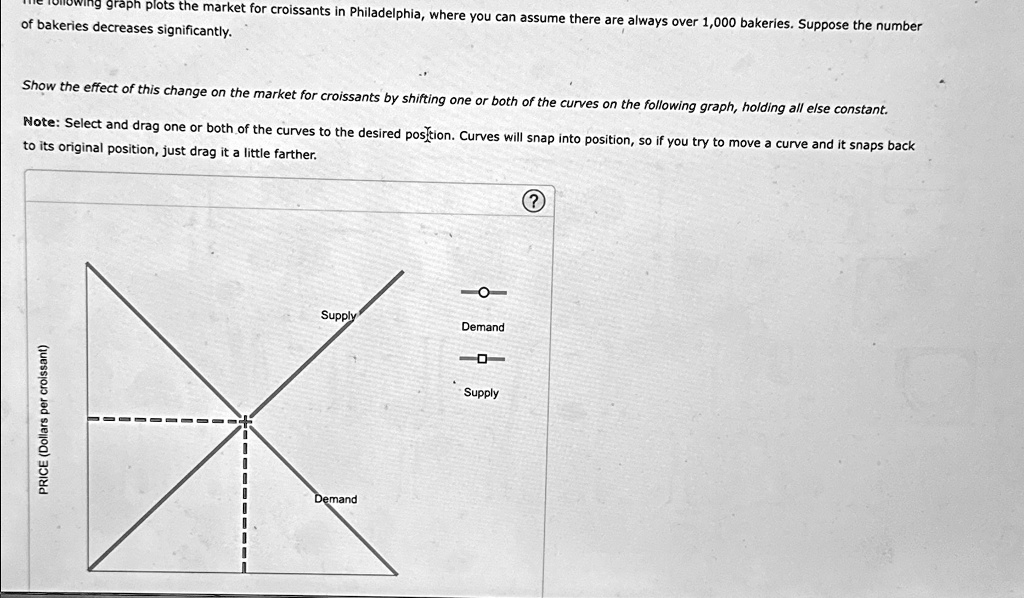
graph plots the market for croissants in Philadelphia, where you can assume there are always over 1,000 bakeries. Suppose the number
of bakeries decreases significantly.
Show the effect of this change on the market for croissants by shifting one or both of the curves on the following graph, holding all else constant.
Note: Select and drag one or both of the curves to the desired position. Curves will snap into position, so if you try to move a curve and it snaps back
to its original position, just drag it a little farther.
PRICE (Dollars per croissant)
Supply
Demand
Demand
Supply