Steps for
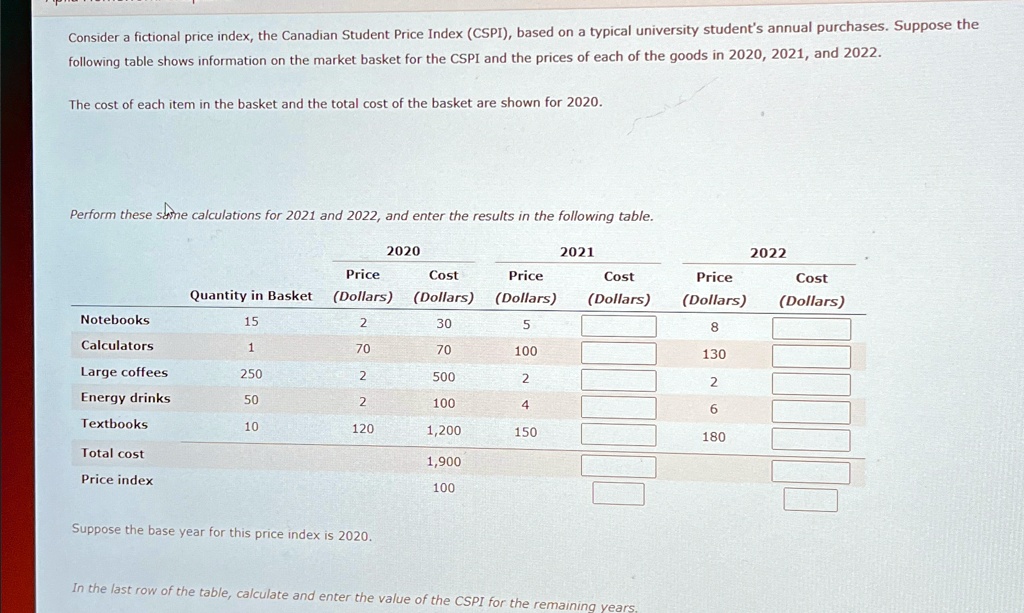
Consider a fictional price index, the Canadian Student Price Index (CSPI), based on a typical university student's annual purchases. Suppose the following table shows information on the market basket for the CSPI and the prices of each of the goods in 2020, 2021, and 2022.
The cost of each item in the basket and the total cost of the basket are shown for 2020.
Perform these calculations for 2021 and 2022, and enter the results in the following table.
[
�egin{array}{|c|c|c|c|c|}
hline
& ext{Quantity in Basket} & 2020 & 2021 & 2022 \
& & ext{Price (Dollars)} & ext{Cost (Dollars)} & ext{Price (Dollars)} & ext{Cost (Dollars)} \
hline
ext{Notebooks} & 15 & 2 & 30 & 5 & 8 \
ext{Calculators} & 1 & 70 & 70 & 100 & 130 \
ext{Large coffees} & 250 & 2 & 500 & 2 & 2 \
ext{Energy drinks} & 50 & 2 & 100 & 4 & 6 \
ext{Textbooks} & 10 & 120 & 1,200 & 150 & 180 \
ext{Total cost} & & & 1,900 & & \
ext{Price index} & & & 100 & & \
hline
end{array}
]
Suppose the base year for this price index is 2020.
In the last row of the table, calculate and enter the value of the CSPI for the remaining years.