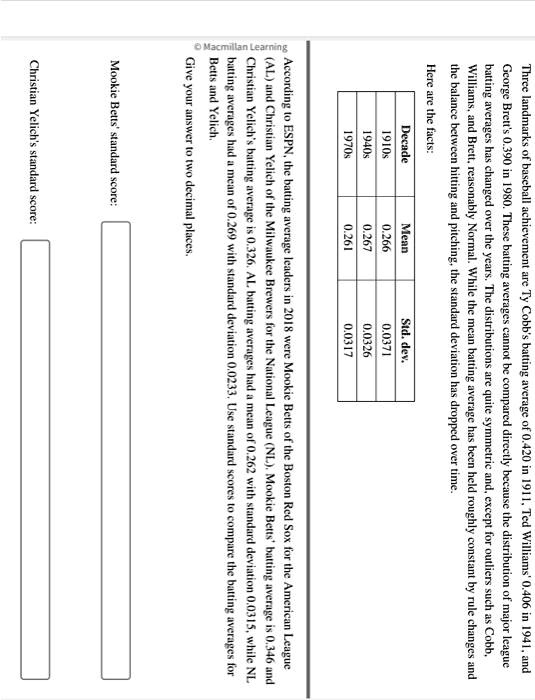
Three landmarks of baseball achievement are Ty Cobb's batting average of 0.420 in 1911, Ted Williams' 0.406 in 1941, and George Brett's 0.390 in 1980. These batting averages cannot be compared directly because the distribution of major league batting averages has changed over the years. The distributions are quite symmetric and, except for outliers such as Cobb, Williams, and Brett, reasonably Normal. While the mean batting average has been held roughly constant by rule changes and the balance between hitting and pitching, the standard deviation has dropped over time.
Here are the facts:
Decade Mean Std. dev.
1910s 0.266 0.0371
1940s 0.267 0.0326
1970s 0.261 0.0317
According to ESPN, the batting average leaders in 2018 were Mookie Betts of the Boston Red Sox for the American League (AL) and Christian Yelich of the Milwaukee Brewers for the National League (NL). Mookie Betts' batting average is 0.346 and Christian Yelich's batting average is 0.326. AL batting averages had a mean of 0.262 with standard deviation 0.0315, while NL batting averages had a mean of 0.269 with standard deviation 0.0233. Use standard scores to compare the batting averages for Betts and Yelich.
Give your answer to two decimal places.
Mookie Betts' standard score:
Christian Yelich's standard score: