[7 Marks]
Q 2(a)
Explain the concept of risk aversion and explain the ways in which risk aversion may
be estimated.
Q 2(b)
[18 Marks]
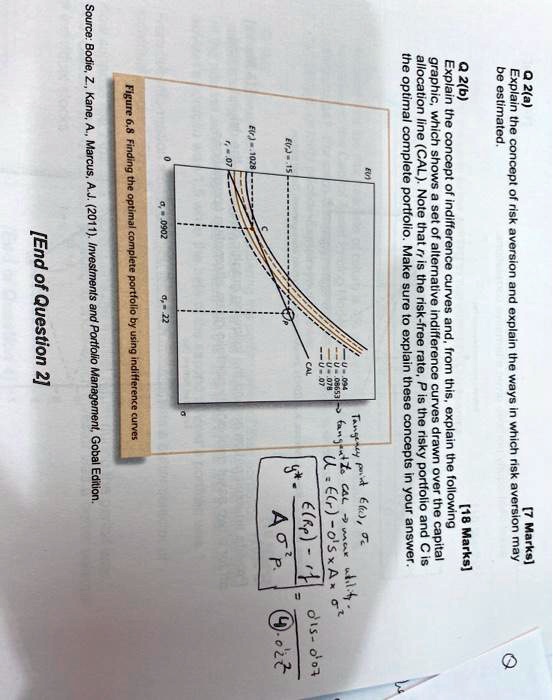
Explain the concept of indifference curves and, from this, explain the following
graphic, which shows a set of alternative indifference curves drawn over the capital
allocation line (CAL). Note that $r_f$ is the risk-free rate, P is the risky portfolio and C is
the optimal complete portfolio. Make sure to explain these concepts in your answer.
$E(r) = 15$
$E(r) = 1028$
$r_f = 0.07$
$U = 0.94$
$U = 0.8653$
$U = 0.78$
$U = 0.7$
CAL
Tangency point $\left(\bar{r}, \bar{\sigma}\right)$,
$\text{tangent to CAL max utility}$
$U = E(r) - \frac{1}{2} \times A \times \sigma^2$
$y^* = \frac{E(r_p) - r_f}{A \sigma_p^2} = \frac{0.15 - 0.07}{4 \times 0.22^2}$
$P$
$\sigma_p = 0.902$
$\sigma_p = 0.22$
Figure 6.8 Finding the optimal complete portfolio by using indifference curves
Source: Bodie, Z., Kane, A., Marcus, A.J. (2011). Investments and Portfolio Management, Gobal Edition.
[End of Question 2]