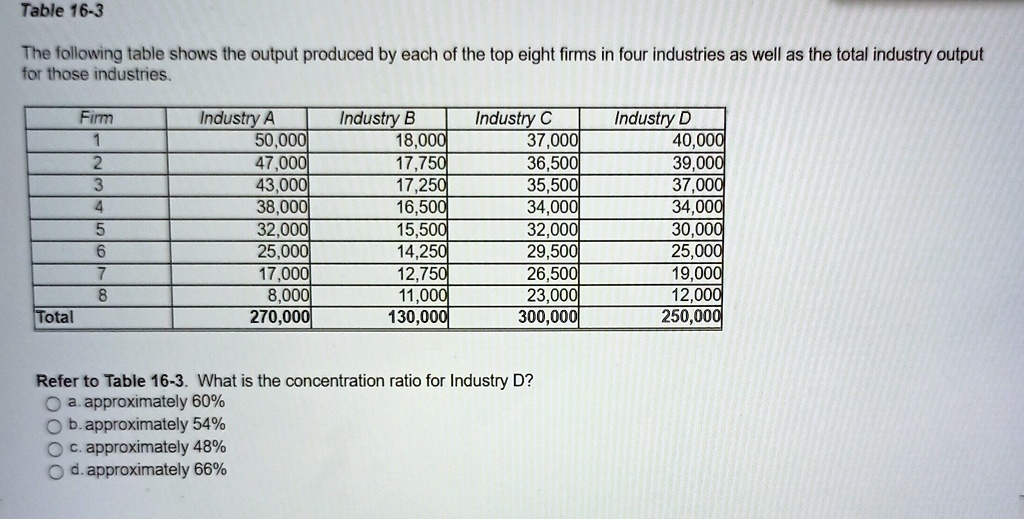
Table 16-3
The following table shows the output produced by each of the top eight firms in four industries as well as the total industry output
for those industries.
Firm
Industry A
Industry B
Industry C
Industry D
1
50,000
18,000
37,000
40,000
2
47,000
17,750
36,500
39,000
3
43,000
17,250
35,500
37,000
4
38,000
16,500
34,000
34,000
5
32,000
15,500
32,000
30,000
6
25,000
14,250
29,500
25,000
7
17,000
12,750
26,500
19,000
8
8,000
11,000
23,000
12,000
Total
270,000
130,000
300,000
250,000
Refer to Table 16-3. What is the concentration ratio for Industry D?
a. approximately 60%
b. approximately 54%
c. approximately 48%
d. approximately 66%