In a chemical process, the parameters of temperature, pressure, proportion of catalyst, and pH value...
Description
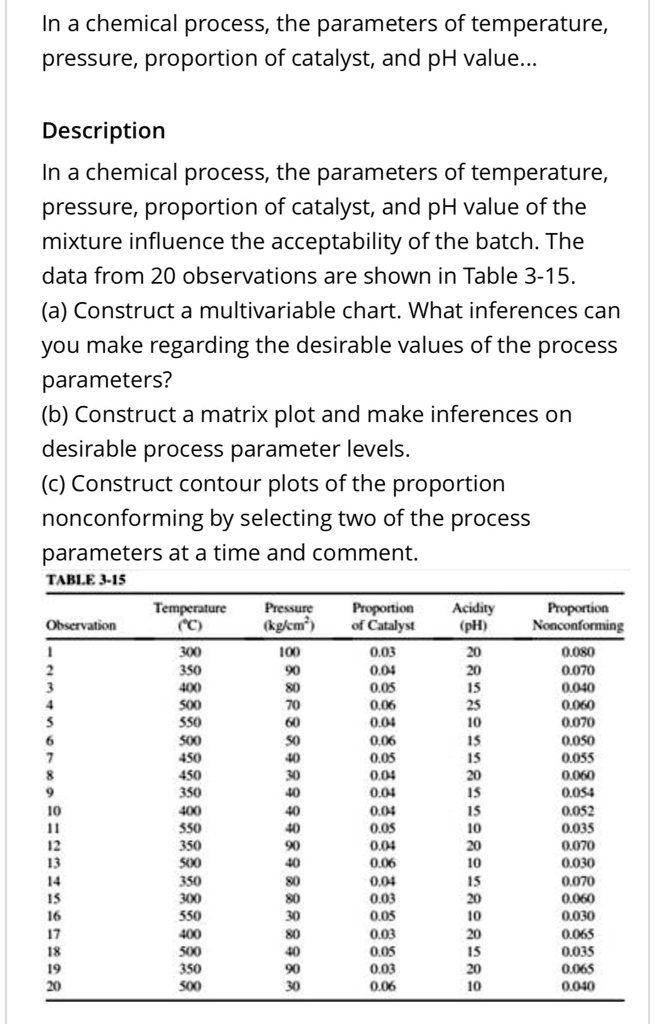
In a chemical process, the parameters of temperature, pressure, proportion of catalyst, and pH value of the mixture influence the acceptability of the batch. The data from 20 observations are shown in Table 3-15.
(a) Construct a multivariable chart. What inferences can you make regarding the desirable values of the process parameters?
(b) Construct a matrix plot and make inferences on desirable process parameter levels.
(c) Construct contour plots of the proportion nonconforming by selecting two of the process parameters at a time and comment.
TABLE 3-15
able[[Observation, able[[Temperature],[('C)]], able[[Pressure],[(k(g)/(c)m^(2))
In a chemical process, the parameters of temperature
pressure, proportion of catalyst, and pH value...
Description
In a chemical process, the parameters of temperature
pressure, proportion of catalyst, and pH value of the mixture influence the acceptability of the batch. The
data from 20 observations are shown in Table 3-15.
(a) Construct a multivariable chart.What inferences can you make regarding the desirable values of the process parameters? (b) Construct a matrix plot and make inferences on desirable process parameter levels. (c) Construct contour plots of the proportion
nonconforming by selecting two of the process
parameters at a time and comment. TABLE3-15 Temperature Pressure Proportion Observation (3 (kg/cm) of Catalyst 1 300 100 0.03 2 350 90 0.04 3 400 80 0.05 4 500 70 0.06 5 550 60 100 6 500 50 0.06 7 450 40 0.05 8 450 30 10'0 9 350 40 t00 10 400 40 0.04 11 550 40 12 350 90 t00 13 500 40 0.06 14 350 80 100 15 300 o8 0.03 16 550 30 0.05 17 400 80 0.03 18 500 40 0.05 19 350 90 0.03 20 500 30 0.06
Acidity (pH) 20 20 15 25 10 15 15 20 15 15 10 20 10 15 20 10 20 15 20 10
Proportion Nonconforming 0.080 0.070 0.040 0.060 0.070 0.050 0.055 0.060
0.052 0.035 0.070 0000 0.070 0.060 0000 0.065 0.035 0.065 0100