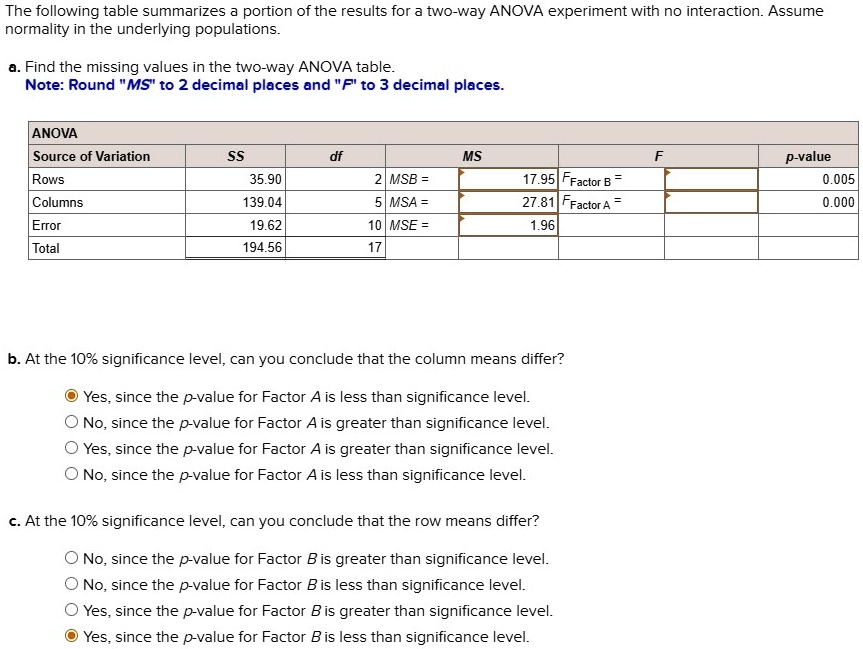
The following table summarizes a portion of the results for a two-way ANOVA experiment with no interaction. Assume normality in the underlying populations.
a. Find the missing values in the two-way ANOVA table.
Note: Round "MS" to 2 decimal places and "F" to 3 decimal places.
ANOVA
Source of Variation SS df MS F p-value
Rows 35.90 2 $MSB = 17.95 F_{Factor B} =$ 0.005
Columns 139.04 5 $MSA = 27.81 F_{Factor A} =$ 0.000
Error 19.62 10 $MSE = 1.96$
Total 194.56 17
b. At the 10% significance level, can you conclude that the column means differ?
Yes, since the p-value for Factor A is less than significance level.
No, since the p-value for Factor A is greater than significance level.
Yes, since the p-value for Factor A is greater than significance level.
No, since the p-value for Factor A is less than significance level.
c. At the 10% significance level, can you conclude that the row means differ?
No, since the p-value for Factor B is greater than significance level.
No, since the p-value for Factor B is less than significance level.
Yes, since the p-value for Factor B is greater than significance level.
Yes, since the p-value for Factor B is less than significance level.