INSTRUCTION: Use the survey result to illustrate the sets and subsets then create a Venn diagram showing the union and intersection of sets.
Scenario:
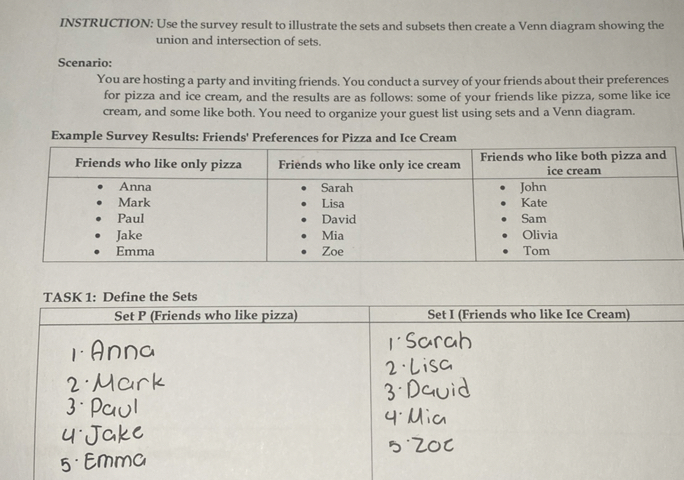
You are hosting a party and inviting friends. You conduct a survey of your friends about their preferences for pizza and ice cream, and the results are as follows: some of your friends like pizza, some like ice cream, and some like both. You need to organize your guest list using sets and a Venn diagram.
Example Survey Results: Friends' Preferences for Pizza and Ice Cream
TASK 1: Define the Sets
\begin{tabular}{|l|l|}
\hline Set P (Friends who like pizza) & \multicolumn{1}{c|}{ Set I(Friends who like Ice Cream) } \\
\hline 1. Anna & 1. Sarah \\
\( 2 \cdot \) Mark & \( 2 \cdot \) Lisa \\
\( 3 \cdot \) Paul & \( 3 \cdot \) David \\
\( 4 \cdot \) Jake & \( 4 \cdot \) Mia \\
\( 5 \cdot \) Emma & \( 5 \cdot 20 \) e \\
\hline
\end{tabular}