Midterm 1
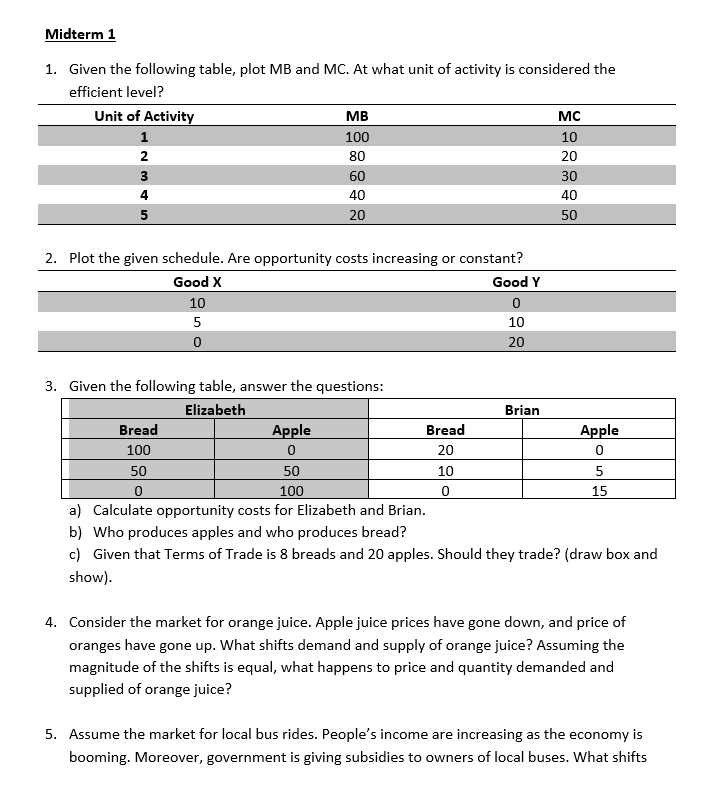
1. Given the following table, plot MB and MC. At what unit of activity is considered the
efficient level?
Unit of Activity
1
2
3
4
5
MB
100
80
60
40
20
2. Plot the given schedule. Are opportunity costs increasing or constant?
Good X
10
5
0
3. Given the following table, answer the questions:
Elizabeth
Bread
100
50
0
Apple
0
50
100
Good Y
0
10
20
MC
10
20
30
40
50
Brian
Bread
Apple
20
0
10
5
0
15
a) Calculate opportunity costs for Elizabeth and Brian.
b) Who produces apples and who produces bread?
c) Given that Terms of Trade is 8 breads and 20 apples. Should they trade? (draw box and
show).
4. Consider the market for orange juice. Apple juice prices have gone down, and price of
oranges have gone up. What shifts demand and supply of orange juice? Assuming the
magnitude of the shifts is equal, what happens to price and quantity demanded and
supplied of orange juice?
5. Assume the market for local bus rides. People's income are increasing as the economy is
booming. Moreover, government is giving subsidies to owners of local buses. What shifts